Month-Over-Month
- 0.4% decrease in pending home sales
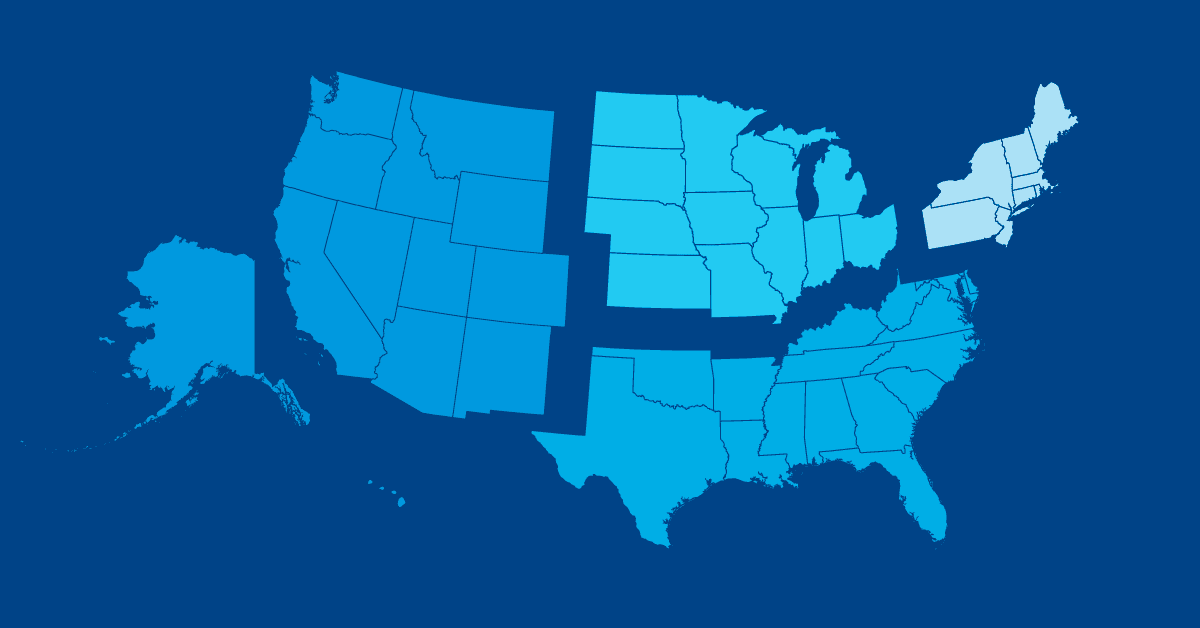
- Declines in the Midwest and Northeast; essentially flat in the South; gains in the West
Year-Over-Year
- 0.7% increase in pending home sales
- Increase in Midwest and South; decline in Northeast and West
WASHINGTON (August 28, 2025) – Pending home sales decreased by 0.4% in July from the prior month and rose 0.7% year-over-year, according to the National Association of REALTORS® Pending Home Sales report. The Report provides the real estate ecosystem, including agents and home buyers and sellers, with data on the level of home sales under contract.
Pending sales declined month-over-month in the Northeast and Midwest, held essentially flat in the South, and rose in the West. Year-over-year, sales decreased in the Northeast and West but increased in the Midwest and South. July's REALTORS® Confidence Index survey shows that 16% of NAR members expect an increase in buyer traffic over the next three months, unchanged from one year ago. Meanwhile, 21% expect an increase in seller traffic, up from 17% in July 2024.
"Even with modest improvements in mortgage rates, housing affordability, and inventory, buyers still remain hesitant," said NAR Chief Economist Lawrence Yun. "Buying a home is often the most expensive purchase people will make in their lives. This means that going under contract is not a decision home buyers make quickly. Instead, people take their time to ensure the timing and home are right for them."
"Rising mortgage applications for home purchase are an early indicator of more serious buyers in the marketplace, though many have not yet committed to a pending contract. The Federal Reserve signaling that they may enact a lower interest rate policy should steadily enlarge the pool of eligible home buyers in the upcoming months."
July 2025 National Pending Home Sales
- 0.4% decrease month-over-month
- 0.7% increase year-over-year
July 2025 Regional Pending Home Sales
Northeast
- 0.6% decrease month-over-month
- 0.6% decrease year-over-year
Midwest
- 4.0% decrease month-over-month
- 1.3% increase year-over-year
South
- 0.1% decrease month-over-month
- 1.8% increase year-over-year
West
- 3.7% increase month-over-month
- 1.9% decrease year-over-year
The percent of change in pending home sales is based on the Pending Home Sales Index (PHSI)* – a forward-looking indicator of home sales based on home-contract signings. An index of 100 is equal to the level of contract activity in 2001.
About the National Association of REALTORS®
The National Association of REALTORS® is involved in all aspects of residential and commercial real estate. The term REALTOR® is a registered collective membership mark that identifies a real estate professional who is a member of the National Association of REALTORS® and subscribes to its strict Code of Ethics. For free consumer guides about navigating the homebuying and selling transaction processes – from written buyer agreements to negotiating compensation – visit facts.realtor.
# # #
*The Pending Home Sales Index is a leading indicator for the housing sector, based on pending sales of existing homes. A sale is listed as pending when the contract has been signed but the transaction has not closed, though the sale usually is finalized within one or two months of signing.
Pending contracts are good early indicators of upcoming sales closings. However, the amount of time between pending contracts and completed sales is not identical for all home sales. Variations in the length of the process from pending contract to closed sale can be caused by issues such as buyer difficulties with obtaining mortgage financing, home inspection problems, or appraisal issues.
The index is based on a sample that covers about 40% of multiple listing service data each month. In developing the model for the index, it was demonstrated that the level of monthly sales-contract activity parallels the level of closed existing-home sales in the following two months.
An index of 100 is equal to the average level of contract activity during 2001, which was the first year to be examined. By coincidence, the volume of existing-home sales in 2001 fell within the range of 5.0 to 5.5 million, which is considered normal for the current U.S. population.
NOTE: Existing-Home Sales for August will be reported on September 23. The next Pending Home Sales Index will be released on September 29. All release times are 10 a.m. Eastern. View the NAR Statistical News Release Schedule.