

")


Please note: The Tableau data visualization embeds on this page are best viewed on a laptop or desktop computer.
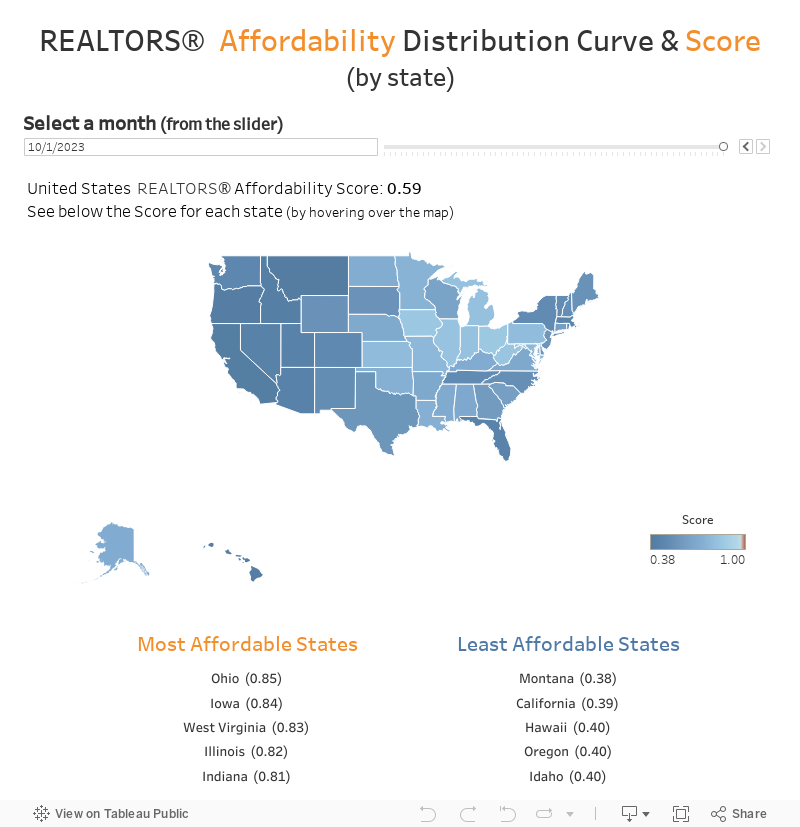
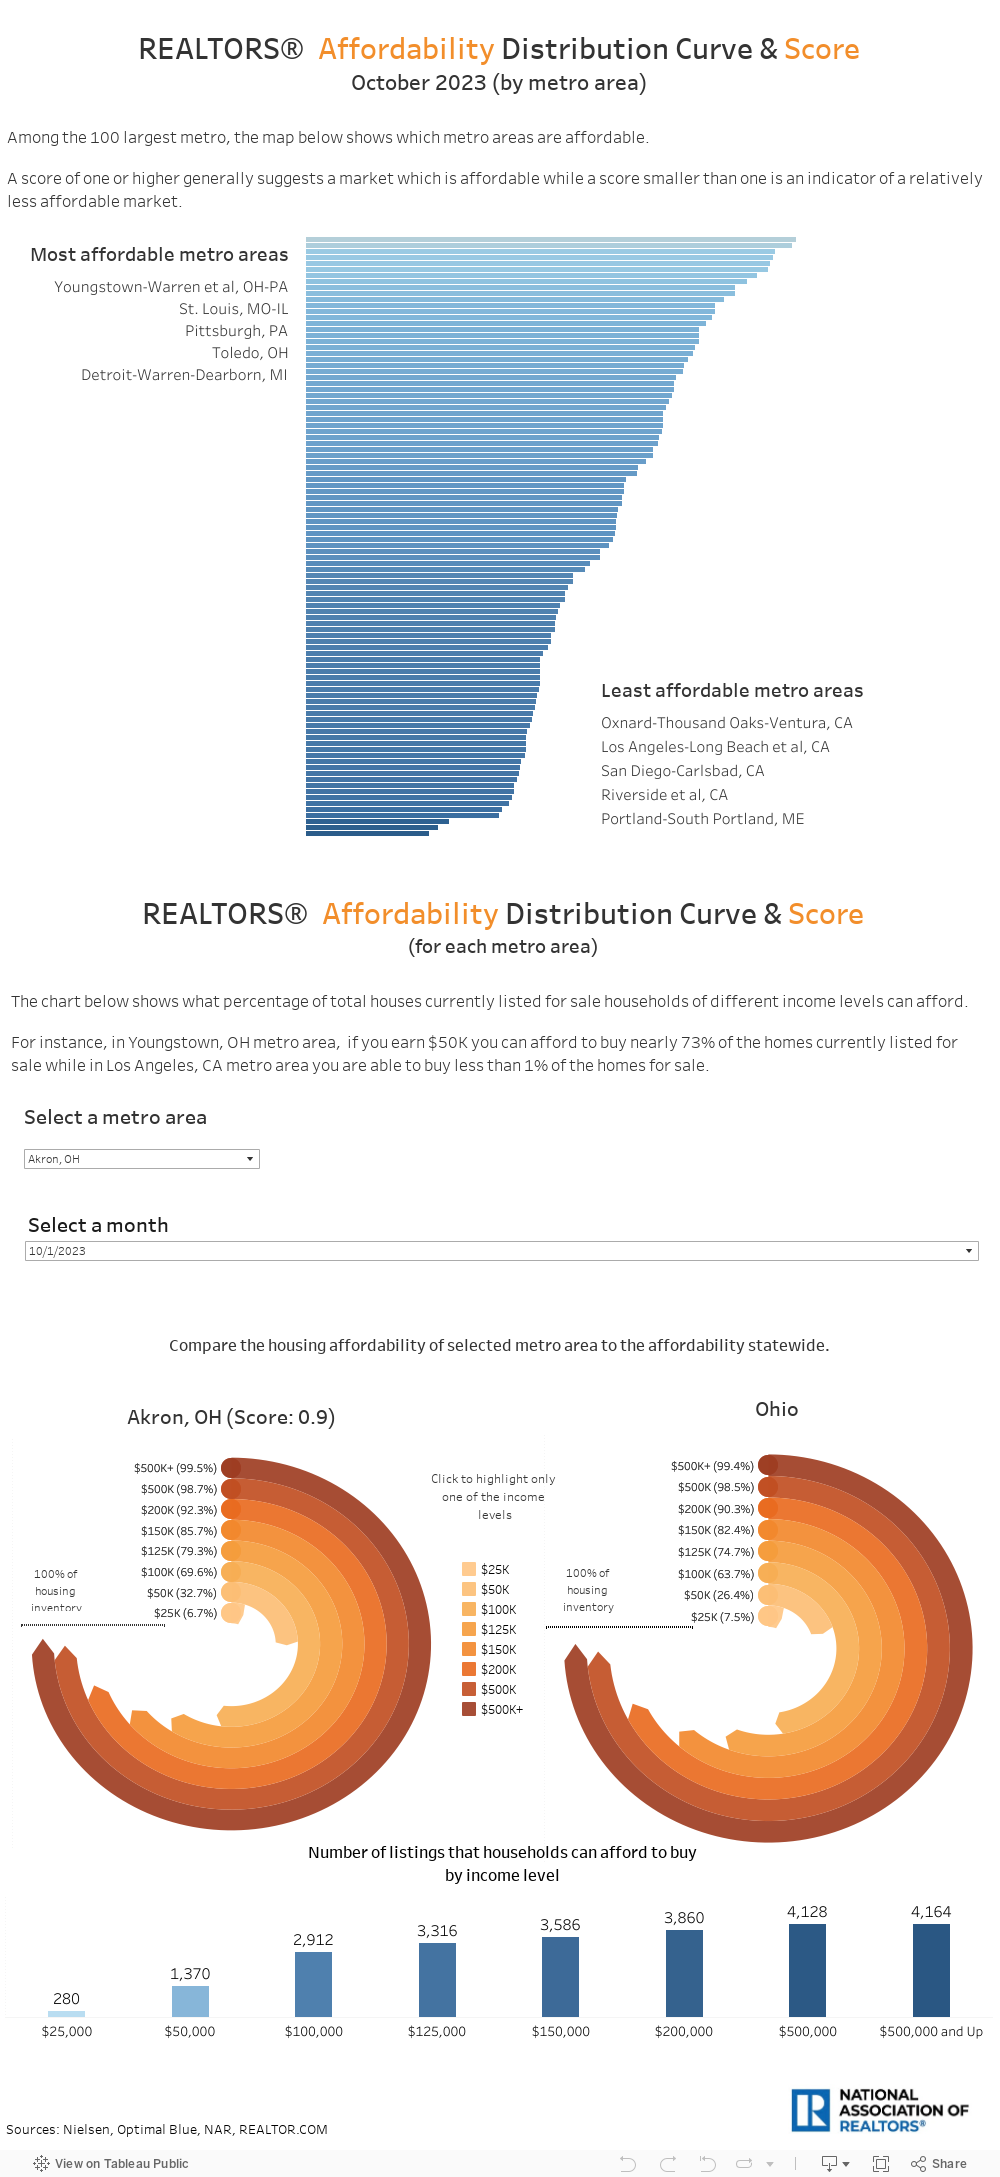
The REALTORS® Affordability Distribution Curve and Score measures housing affordability at different income levels for all active inventory on the market. For each state and the 100 largest metropolitan areas, REALTORS® Affordability Distribution Curve shows how many houses are affordable to households ranked by income while REALTORS® Affordability Distribution Score is the measure which is intended to represent affordability for all different income levels in a single measure.
The REALTORS® Affordability Distribution Score is different in two major ways from the existing Housing Affordability Index (HAI):
- It considers affordability for all income percentiles, not just the median income, and
- It looks at affordability of active inventory or homes currently available for sale instead of homes that have already sold.
Data
Advertisement