


After the strong rebound for the U.S. economy in 2021, growth in 2022 has slowed in the face of rising inflation, the household income squeeze, and geopolitical events. While the economy continues to deal with elevated inflation, data shows a slowdown in the growth of commercial real estate. Demand for apartments and office spaces is lower compared to previous quarters.
Demand for apartments and rent growth decelerates
While the industrial boom continues to show no signs of stopping, multifamily absorption and rent growth are decelerating. Multifamily absorption in the last four quarters was below the pre-pandemic levels, in the range of 60,000-70,000 units. In the meantime, rents rose year-over-year at a slower pace, by less than a double-digit percentage for the last two quarters.
However, government data shows that rent growth is accelerating. Why don't private and government data align? The Consumer Price Index (CPI), which provides information about rent inflation, uses data from the Consumer Expenditure Survey (CES) to determine the level of prices for goods and services. While this is a survey, most renters report the rent they have locked in earlier. As a result, rent changes may take months to show up in government data. In contrast, the private sector publishes the listed rents – current rent prices. Thus, government data will likely show a decelerating trend in rent prices after several months.
However, multifamily housing demand remains relatively strong. Given rising mortgage rates and home prices, people may be forced to rent for longer due to decreasing affordability.
The office sector continues to struggle amid hybrid work conditions
As the country navigates hybrid work, the office sector continues to struggle. In Q3 2022, about 1.34 million more square feet of office space was vacant and placed on the market than were leased. Although more people returned to their offices, after four quarters with positive net absorption, demand for office space dropped as net absorption turned negative again. As a result, the market's net demand for office spaces decreased relative to supply, and the vacancy rate rose to 12.4% in Q3 2022 from 12.3% in the previous quarter. Meanwhile, the office sector has the highest vacancy rate across all sectors of the commercial real estate market.
Demand for retail spaces has remained positive for seven straight quarters
Retail sales – excluding gas, auto, and non-store retailers – advanced to $383 billion in August, a 19% increase from pre-pandemic levels (August 2019). As a result, net absorption increased to 23.3 million sq. ft. in the third quarter of 2022, a 22% increase from the second quarter. Meanwhile, neighborhood retail that offers in-person services continues to advance even faster. Net absorption for neighborhood centers rose by 35 percentage points compared to the year's second quarter.
The industrial sector shows no signs of stopping
The industrial sector continues to outperform. Demand is robust as net absorption was nearly 425 million sq. ft. in the last 12 months ending in Q3 2022. Although demand may have tapered, the volume of industrial space absorbed continues to be double that of pre-pandemic times. As a result, this sector had the lowest vacancy rate, at 4%, of any other sector in the commercial real estate market.
As demand remains strong, rent growth of industrial spaces continues at historic highs, rising by a double-digit percentage (12%) in Q3 2022. Meanwhile, rents are rising even faster for logistics space by 13.5% year-over-year.
Hotel occupancy rose during the summer but remained below pre-pandemic levels
Several factors go into evaluating the performance of the hotel sector. The three most prevailing measures are the occupancy rate, Average Daily Rate (ADR), and Revenue Per Available Room (RevPAR). First, the occupancy rate shows how many rooms are occupied. Thus, a higher occupancy rate translates to higher demand. Second, the ADR measures how much revenue is made per occupied room, while the RevPAR shows the revenue per available room.
Data shows that these three factors increased in the last three months ending in August compared to the same period a year ago. Hotel occupancy rose to 68.7% from 66.3%; ADR increased to $155/room from $137/room; and RevRAP went up to $107/room from $91/room.
However, hotel occupancy remains below the pre-pandemic level as inflation remains elevated. Hotel occupancy was above 70% during the same period in 2019.
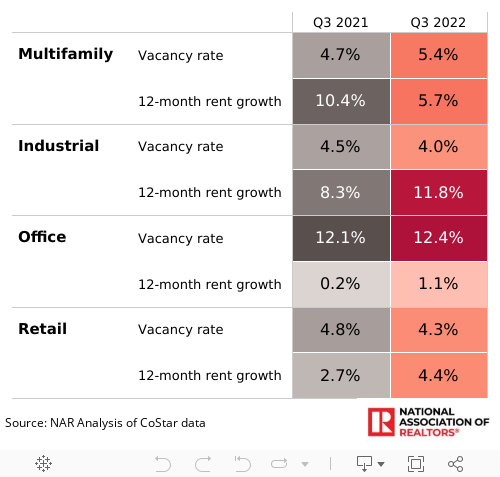
To summarize, the table below shows the vacancy rate and 12-month rent growth by sector:
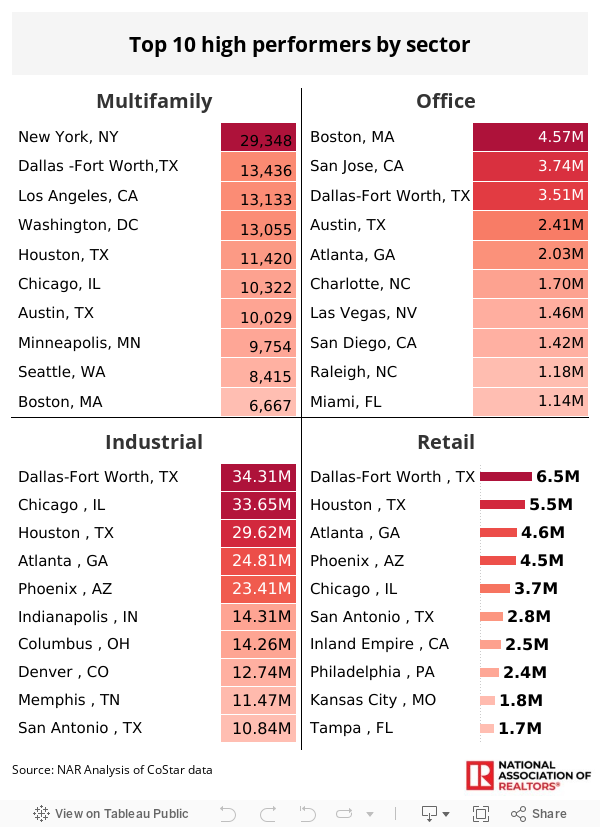
While all real estate is local, commercial real estate performed even better in some areas. Below are the top 10 areas that performed better by sector:
Inflation, interest rates, supply chain woes, and geopolitical events are the main factors that will determine how commercial real estate will perform in the following months. The National Association of REALTORS® will keep you informed monthly about the developments on commercial real estate.
