

")


After years of historically-low housing supply, housing inventory is finally rising across much of the United States. This recent increase — largely driven by the construction boom during the COVID-19 years, when mortgage rates hovered at record lows — has led to modest improvement in affordability in several markets. In fact, in many parts of the South, like Texas, Florida, and Tennessee, inventory has not only recovered but is now higher than it was before the pandemic. Even out West, in places like Colorado, listings have rebounded.
There is no doubt that this is very good news. More inventory typically means more options, and more options can help ease price pressures. In some markets, while home prices are still rising, the rate of growth is starting to slow, offering a bit of relief for buyers who have been experiencing one of the most competitive housing markets in recent memory.
But a closer look reveals a more complex reality. When we examine the data, the housing market remains far from a full recovery and a balanced situation, especially when considering who can afford to purchase these available homes. When viewed through the lens of income and purchasing power, it becomes clear that access to affordable homes remains out of reach for many buyers.
Although the total number of homes for sale has improved since the low point in 2021, many new listings are simply out of reach for a large share of American households. That's why home sales in the lower and middle price tiers remain sluggish and more volatile than the high-end market — high prices, elevated mortgage rates, and a lack of affordable options still squeeze buyers at these levels.
So, the big question we face today is this: How many homes are we still missing from the market that people across the income spectrum can actually afford?
To help answer that question, the National Association of REALTORS® and Realtor.com® partnered to dig into the numbers. But rather than looking at home prices in general or the full housing stock, this analysis focuses on what's available right now—the listings on the market as of March 2025. And then, instead of using a one-size-fits-all affordability measure, we looked at what buyers at different income levels can actually afford based on typical lending standards.
The result is a real-time, income-specific snapshot of housing availability.
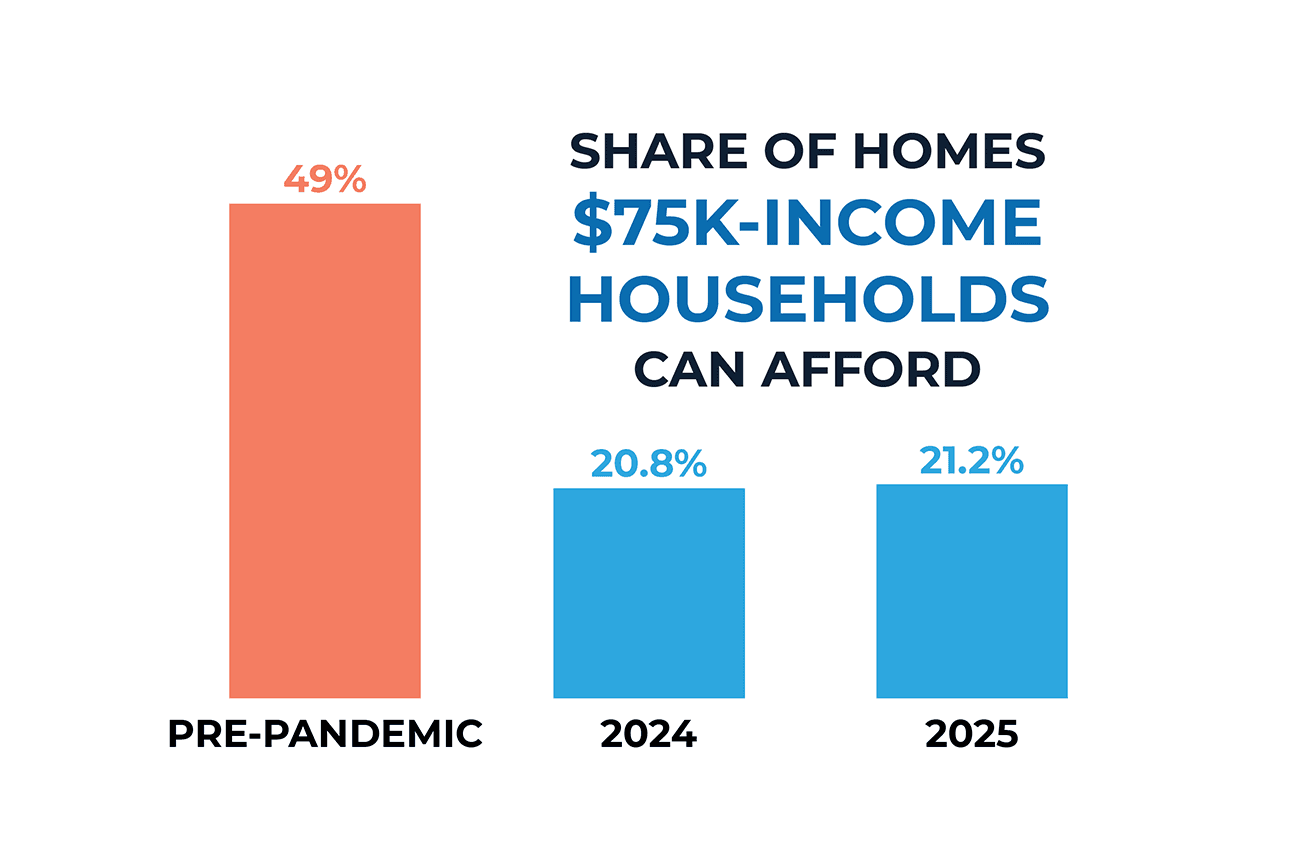
Nationwide, for-sale inventory is up nearly 20 percent from a year ago. Encouragingly, middle- and upper-middle-income buyers — those earning between $75,000 and $100,000 annually — have seen the greatest improvement in affordable housing supply among all income groups. Specifically, in March 2024, 20.8 percent of listings were within reach for these households. By March 2025, that share rose modestly to 21.2 percent.
While the for-sale inventory gain marks a step in the right direction, it's still a long way from pre-pandemic conditions. In 2019, buyers in this income bracket could afford nearly half, 48.8 percent, of all active listings. A balanced market would offer them access to approximately 48.1 percent of listings, suggesting a shortage of nearly 416,000 listings priced at or below $255,000.
At the lower end of the income spectrum, conditions have not improved and, in fact, have worsened. Buyers earning less than $50,000 per year, who are looking for homes priced under $170,000, now face even fewer affordable options than they did a year ago. This highlights a growing affordability gap: while some groups are seeing slow gains, lower-income households continue to be disproportionately priced out of the market.
In this report, we explore:
- How much of today's inventory is affordable for different income groups
- How that has changed since before the COVID-19 pandemic
- The size of the current “affordability gap”
- Which markets are recovering, and which markets are falling further behind
Understanding these dynamics matters. For REALTORS®, it means being able to better-guide clients and manage expectations. For local leaders and policymakers, it points to where supply gaps are most urgent. And for homebuilders and developers, it offers a clearer view of where demand is being left unmet.
The rise in housing inventory is real, and it's encouraging. But if we want a truly healthy housing market, we need to make sure that inventory growth translates into real opportunities for everyone.
Ultimately, it's good news that more homes are coming on the market - but it's not enough to say the housing market is back to normal. The problem is that many of these new listings still aren't affordable for many buyers. To truly fix the affordability crisis, we need a more targeted approach – one that focuses on adding homes at the price points where demand is strongest and the gaps are greatest. Otherwise, even with more inventory, too many people will continue to be left out of the market.
Middle-Income Buyers Face the Largest Housing Shortage
America's housing inventory is growing again - but for millions of buyers, it's still not enough. New national data shows that middle-income buyers have seen the most improvement over the past year, but they still face the largest shortage of listings relative to what a balanced market should offer.
- A household earning $50,000 can only afford 8.7% of listings today, down from 9.4% a year ago.
- Households earning $75,000 a year – often made up of teachers, nurses, and skilled trades workers – can afford 21.2 percent of listings as of March 2025.
- Households earning $100,000 annually are in a similar situation. They can now afford 37.1 percent of listings, up slightly from 36.9 percent in March of 2024.
- Higher-income households have near-total access to the market. Buyers earning $200,000 or more can afford 80 percent to 100 percent of the listings.
The data suggests that our country needs to add at least two affordable homes for middle-income buyers (up to $255,000) for every home listed above $680,000.
Thus, middle-income buyers - those who are supposed to form the backbone of the homebuying market - are making progress, but they're still shut out of more than half of the homes for sale today. Without a significant boost in housing inventory at price points below $260,000, the path to homeownership will remain blocked for millions of Americans who are otherwise financially ready to buy.

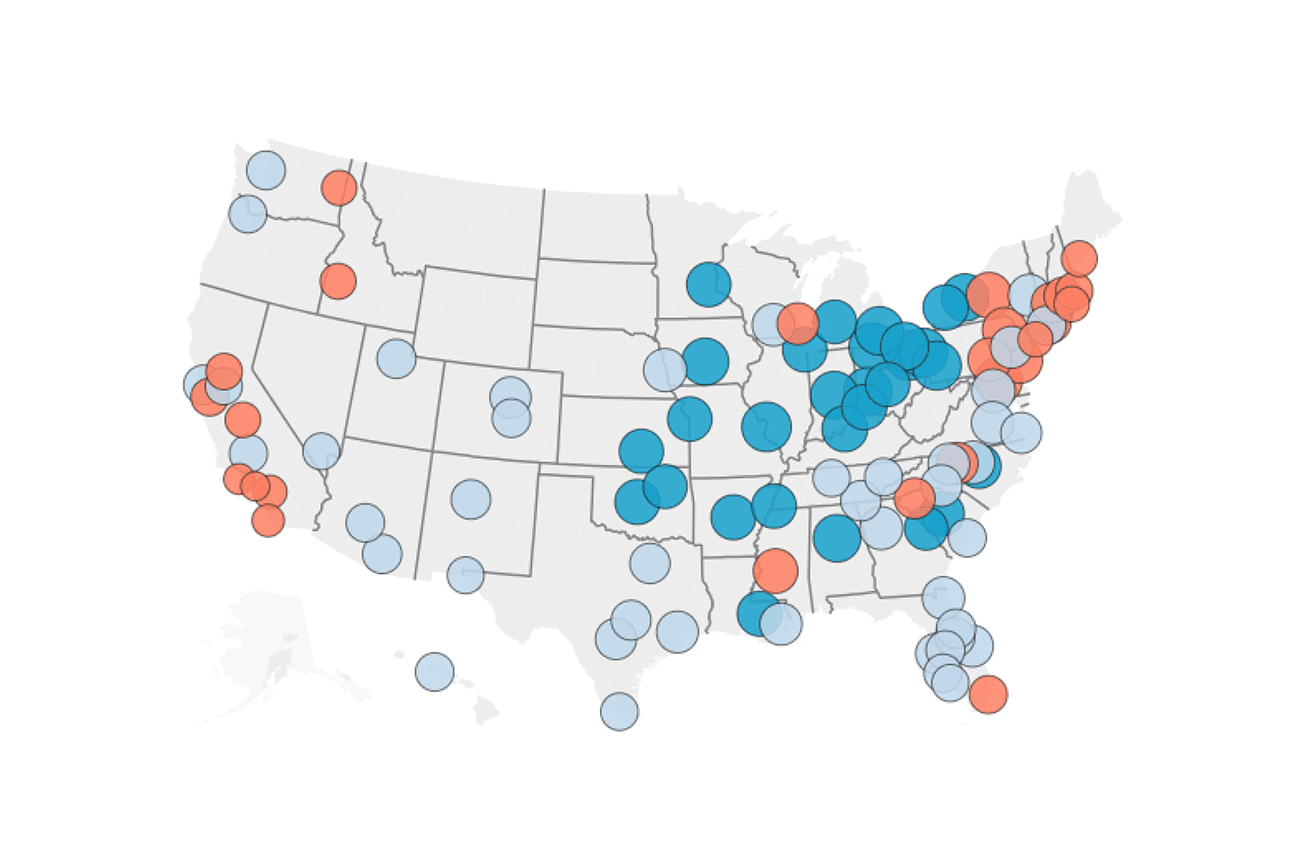
Three Types of Local Markets: Who's Close, Who's Stuck, and Who's Falling Behind
While the national picture of housing affordability provides essential context, it's only part of the story. That's because housing is not one market — it's thousands of local markets, each with its own dynamics. Home buyers don't purchase homes in "the national market"; they buy within specific metro areas, neighborhoods, and school districts. What's affordable in Cincinnati might be completely unattainable in San Diego. What's driving supply constraints in one area may not be relevant in another. These local variations — driven by differences in job growth, land use and other policies, infrastructure, demographic trends, and economic conditions — can significantly shape the opportunities available to would-be buyers.
Based on the analysis, we identified three groups:
- Areas Getting Closer to Balance: where the availability of affordable homes has improved significantly in the past year, and it is relatively strong across income levels.
- Areas Stuck in the Middle: where supply and demand are misaligned but not at crisis levels.
- Areas Falling Further Behind: where the gap from a balanced market continues to increase.
1. Areas Getting Closer to Balance
30 percent of the 100-largest metro areas
The areas getting closer to a balanced housing market (30% of the 100 largest metro areas) are the quiet achievers, because the availability of affordable listings is better than in other areas. Many of these markets have historically offered better alignment between home prices and local incomes, and they continue to maintain that balance. However, what stands out this year is the progress made by additional markets that were not previously considered affordable but have significantly improved over the past 12 months.

2. Areas Stuck in the Middle
44% of the 100 largest metro areas
The areas stuck in the middle are where most of America's housing story plays out. These markets are not in the extremes but somewhere in between. These are the markets that aren't in crisis, but they aren't thriving either. They're stuck in the middle, struggling to keep up with demand, showing signs of progress, yet still falling short of offering real affordability to most families.

3. Areas Falling Further Behind
26% of the 100 largest metro areas
While some metro areas are making progress and others are just holding steady, there's a set of metros where things are actually getting worse; the markets are moving in the wrong direction.
These are the markets where the housing situation is not just unaffordable, it's getting worse. In these metro areas, the availability of affordable listings has either declined over the past year or remains more than 20 percentage points below what we would consider a balanced market. That's a significant gap - one that signals a growing divide between what homes cost and what local families can actually afford.

State-Level Analysis of Housing Affordability and Supply Gaps
An evaluation of housing supply across states reveals significant variations in both current access and supply gaps when benchmarked against a balanced market. To illustrate the varied dynamics in housing affordability and supply — using an affordability distribution score for each state — this section highlights five states in each of the following key categories:
- States Closest to a Balanced Market
- States with the Largest Shortfall of Affordable Listings
- States with the Most Significant Improvements in 2025
The data reveals a housing landscape marked by both resilience and acute shortfalls. While some Midwestern and Southern states maintain relatively balanced markets, coastal and Western states remain under intense affordability pressure. Even where gains have occurred, nearly all states remain below their pre-pandemic levels. These findings highlight the need for local policy solutions that address local constraints and target affordability.

More Homes, But Still Not Enough Where it Matters Most
The story of the 2025 housing market is one of both progress and persistent imbalance. Inventory is rising - a welcome shift after years of extreme scarcity. For middle-income buyers, there are signs of improvement, and in some parts of the country, real progress has been made to close the affordability gap. But those gains are uneven. Many buyers, especially those earning less than $75,000, are seeing little-to-no benefit from rising supply. In fact, for some, the market has become even less accessible.
This analysis makes clear that simply increasing the number of homes for sale is not enough. We must build the right homes, at the right prices, and in the right places. The market has not yet corrected for affordability—it requires intentional effort and targeted strategies that prioritize inclusivity and equity.
At the national level, middle-income households are still locked out of more than half of the homes for sale. To reach a balanced market, we would need hundreds of thousands of additional listings priced below $255,000 - homes that teachers, nurses, and skilled workers can actually afford. Meanwhile, lower-income households – which represent a third of all U.S. households - have almost no access to for-sale homes. And in many of the country’s largest and most economically-vital metros, the affordability gap is even larger.
The local picture is just as telling. While a handful of metros are getting closer to balance and showing that change is possible, most are stuck in the middle, unable to make the leap needed to truly expand housing access.
This is not just a housing issue - it’s an economic, social, and generational one. A market where only the highest earners can buy a home is not sustainable. That limits mobility, opportunity, and makes it harder for millions of Americans to use homeownership as a path to stability and wealth-building.
We are at a turning point. The increase in inventory presents a real opportunity - but only if we ensure that future housing-supply growth is aligned with actual housing demand. This means supporting zoning reform, expanding down-payment assistance, removing barriers to entry-level construction, and investing in solutions that reflect the financial realities of today’s home buyers.
Looking Ahead
Solving the persistent housing shortage across our country requires a multifaceted approach that involves stakeholders at all levels, including governments, developers, and communities. The goal is to create a balanced and sustainable housing market that meets the demand needs of people at any income level, particularly those most in need of affordable options. Key components of this challenge include reforming local land-use and zoning regulations to foster more development, expanding vocational training programs to ensure an adequate labor supply, and actively promoting these initiatives.