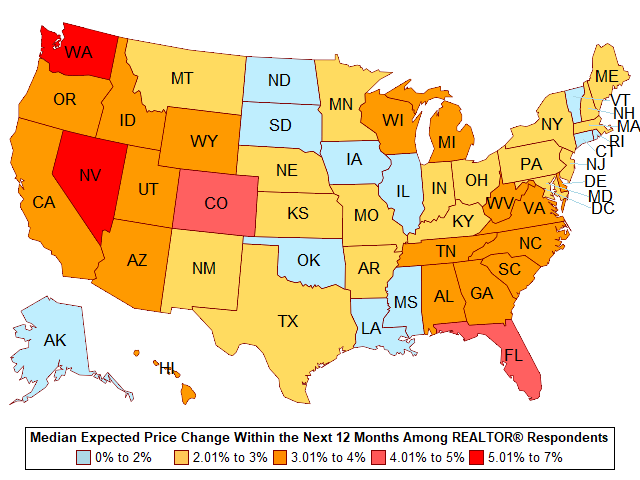
In the monthly REALTORS® Confidence Index Survey, the National Association of REALTORS® asks members “In the neighborhood or area where you make most of your sales, what are your expectations for residential property prices over the next year?”
Among the REALTOR® respondents who responded to the December 2017 survey, the median expected price change for the next 12 months was 3.1 percent, according to the December 2017 REALTORS® Confidence Index Survey.[1]
The map below shows the median expected price change of the respondents in the next 12 months at the state level for surveys conducted in October—December 2017. REALTOR® respondents from Washington and Nevada had the highest median expected price growth of more than five to seven percent. In Colorado and Florida, the median expected price growth was four to five percent. Worth noting is that even in states with high property tax rates or property prices, such as New York, New Jersey, Connecticut, and California—states which are the most affected by the Tax Cuts and Jobs Act that put a cap on total itemized deductions property and state and local taxes — respondents expect either no change or a modest price appreciation of at most two percent.[2]

With the median home price of existing homes at $246,800 in December 2017 (cumulative change of 60 percent since January 2012), and with fewer inventory of homes for sale at their lowest level since January 1999 (3.2 months’ supply), REALTORS® expect prices to continue to appreciate in the next 12 months. In many metro areas, listing prices are up by double-digit rates, as the number of homes listed for sale have also fallen steeply. Below is data from Realtor.com on metro areas where REALTOR® respondents expected the strongest price growth in the next 12 months:
Washington. According to Realtor.com data, the median list price rose in all Washington metro areas in December 2017 compared to one year ago, except for Port Angeles (-3.7%) even as the number of listings fell (-5.3%). The highest year-on-year price gain was in Centralia (+22.5%), even as the number of listings rose (+31%). In the Seattle-Tacoma-Bellevue area which has the highest median list price ($495,045), the list price also rose double-digit (+16%), even as the number of listings also rose (+64%).
Nevada. The median list price in Reno, Nevada rose at double-digit (15.4%) as the number of listings also declined at a double-digit rate (-25.9%). Only Boulder (+9.6%) and Greely (+7.9%) had more listings in December 2017 compared to one year ago.
Colorado. The median list price rose across all Colorado’s metro areas, led by Glenwood Springs where the median list price rose at a strong pace (+21.6%) as listings also fell heftily (-16%).
Florida. Some metro areas in the western coast still appear to be recovering from Hurricane Irma’s devastation, with median list prices in these areas below their levels one year ago: Naples-Immokalee-Marco Island (-3%), Cape Coral-Fort Myers (-2.7%), North Point-Bradenton-Sarasota (-2.8%), and Sebring (-0.6%). However, Key West appears to have recovered (+15.3%), while the median list price in Miami-Fort Lauderdale-West Palm Beach rose at a modest pace (+4.7%). In Orlando-Kissimmee-Sanford, the median list price was up (9.6%) as listings fell (-11.7%).
Use the data visualization below to check out the data across metro areas.
[1] To increase the number of observations for each state, NAR uses data from the last three surveys.
[2] To note, the median expected price change is based on data collected from October—December 2017, while the Trump administration released its proposed tax measures only in November 2017, and the Tax Cuts and Jobs Act was signed by President Trump on December 22, 2017, so October survey responses may not factor in the effect of tax reform measures on price expectations.


