


In a monthly survey of REALTORS®, respondents are asked “In the neighborhood(s) or area(s) where you make the most sales, what are your expectations for residential property prices over the next year?”
Based on the responses of approximately 3,000 REALTORS® who answered this question in the August 2018 REALTORS® Confidence Index Survey, the median expected price change in the next 12 months nationally is 2.1 percent, a slower price appreciation compared to the 4.0 percent average during the January through May 2018 surveys (2.5 percent in July 2018 and 3.0 percent in August 2017).
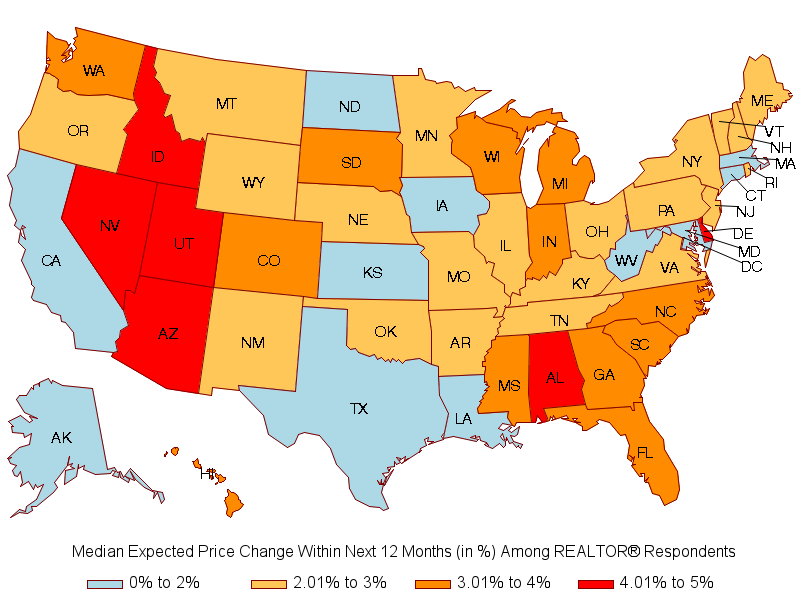
The chart below shows the median expected price change across the U.S. states based on the June, July, and August 2018 surveys of REALTORS®.[1] The median expected price growth ranges from no change to five percent across the states.
REALTORS® who responded to the survey expect prices to typically increase in the state at four percent in Idaho, Nevada, Utah, Arizona, Alabama, and Delaware.
Home prices are also expected to appreciate at three to less than four percent in the states of Washington and Colorado, in some Midwest states (South Dakota, Wisconsin, Michigan, Indiana), in some South states (North Carolina, South Carolina, Georgia, Florida, Mississippi), and in the District of Columbia. (Note: this survey was conducted before Hurricane Florence hit the Carolinas).
However, respondents expect prices to typically increase by less than two percent in California, Texas, Massachusetts, among others. In Connecticut, the median expected price change is zero percent.
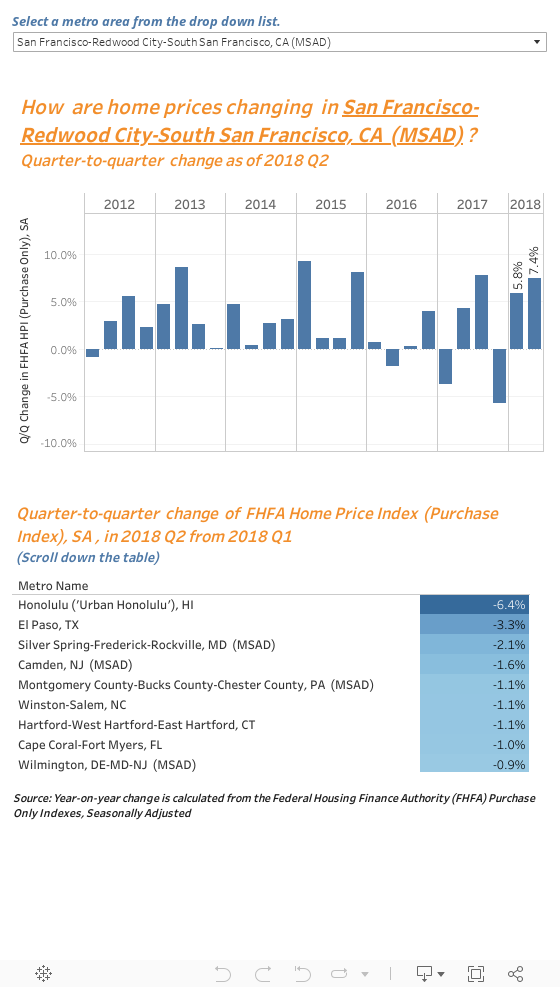
Prices increased only modestly In Los Angeles-Long Beach-Glendale, (0.1%), as well as in Seattle-Bellevue-Everett, WA (0.2%).
Prices still rose strongly in areas such as San Francisco -Redwood City-South-San Francisco, Las Vegas-Henderson-Paradise (4.2%), and Boise, ID (4.6%), among others.
Solid employment growth and tight supply is still bolstering home prices in many areas, but the price appreciation is moderating (and prices are falling in some areas), which should make home prices more affordable for homebuyers.
Use the data visualization tool below to explore how prices changed across the top 100 metros as of 2018 Q2.
About the Realtors® Confidence Index Survey
The RCI Survey gathers information from REALTORS® about local market conditions based on their client interactions and the characteristics of their most recent sales for the month. The August 2018 survey was sent to 50,000 REALTORS® who were selected from NAR’s1.3 million members through simple random sampling and to 8,386 respondents in the previous three surveys who provided their email addresses. There were 4,639 respondents to the online survey which ran from September 1-11, 2018. NAR weights the responses by a factor that aligns the sample distribution of responses to the distribution of NAR membership. The REALTORS® Confidence Index is provided by NAR solely for use as a reference. Resale of any part of this data is prohibited without NAR's prior written consent. For questions on this report or to purchase the RCI series, please email: Data@realtors.org.
[1] In generating the indices, NAR uses data for the last three surveys to have close to 30 observations. Small states such as AK, ND, SD, MT, VT, WY, WV, DE, and D.C., may have fewer than 30 observations.