

")


Did you know there are more households with pets than children? And these beloved pets are a driver of economic activity, namely, home buying. About one-fifth of recent home buyers considered their pet when choosing a neighborhood, a share that increases among unmarried couples and single women buyers. Let’s dive in!
According to the U.S. Census, the share of families with children under the age of 18 living in their home has continued to decline. The share of families with children under the age of 18 in 2024 stood at 39%, down from 52% in 1950. This is likely due to two reasons: Birth rates, overall, have been declining, and a large share of baby boomer households have already seen their children leave the nest.
This trend is also reflected among home buyers. In 1985, 58% of home buyers had children under the age of 18 in their homes. In 2024, just 27% of home buyers had a child under the age of 18 in their home. This is an all-time record low.

While the number of children in U.S. households has declined in the last 20 years, there has been a rise in pet ownership. According to the American Pet Products Association, 71% of American households own a pet. This is up from 56% in 1988. Throughout the COVID-19 pandemic, Americans adopted pets for companionship and entertainment; however, this trend has since eased from its recent peak. The American Pet Product Association reports that dogs and cats are the most common household pets.

Americans are investing a significant amount of time and financial resources in their animals. The amount of time spent with pets has increased significantly over the past 20 years. According to the BLS American Time Use Survey, the share of Americans spending time with their pets and the amount of time spent have both increased. In 2003, 13.2% of Americans spent time with their pets daily. In 2023, that share has grown to 20.4% and 23.8% of women. The amount of time spent on pets has increased from .62 hours in 2003 to .73 hours in 2023. It is not only additional time spent with pets but also finances. According to the American Pet Products Association, total U.S. pet industry expenditures have grown from $53.3 billion in 2012 to $152 billion in 2024.

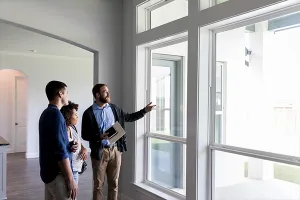
Given the increasing share of pets in households and the growing time and resources devoted to them, it is no surprise that many home buyers consider their pets the most important factor when making homebuying decisions. Factors such as proximity to a veterinarian and outdoor space for pets are important considerations for buyers with pets. Among all unmarried couples, 24% of home buyers considered their pet when deciding on a neighborhood in which to purchase, compared to 15% of married couples. Seventeen percent of single women considered factoring their pet into their neighborhood choice, compared to 12% of single men. This trend is similar to the BLS Time Use Survey, which found women are more likely to spend time with pets daily.

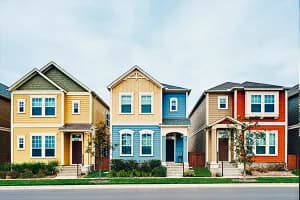
Those who considered their pet to be very important in their neighborhood choice were also more likely to consider other neighborhood features than those who did not factor a pet into their decision. Pet lovers also purchased homes in areas with larger lots or acreage, and were more interested in convenience to parks and recreation areas, as well as walkability. This is likely not a surprise, as it is not just humans who desire these neighborhood features, but the pets themselves that need room to run and play.

For more trends on home buyers and recent activity of buyers, check out the full 2024 Profile of Home Buyers and Sellers report.
Advertisement

Jessica Lautz
Dr. Jessica Lautz is the Deputy Chief Economist and Vice President of Research at the National Association of REALTORS®.