


One of the key economic questions that has arisen during this coronavirus pandemic is whether there is a demographic shift from the cities to the suburbs, or to smaller, less dense counties. NAR’s October REALTORS® Confidence Index Report indicates that this is happening. Among respondents who closed a sale in October, the respondents1 reported that 85% of existing-home sales buyers purchased property in the “suburbs”, “small town”, “rural area”, or “resort area” and the remaining fraction of 15% percent in the “central city/urban area”. This is larger compared to the historical average of about 80%, also the share in February 2020.

Thirty-one percent of respondents also reported that compared to January 2020, they have more clients who live in the city who want to purchase a property in the suburb.

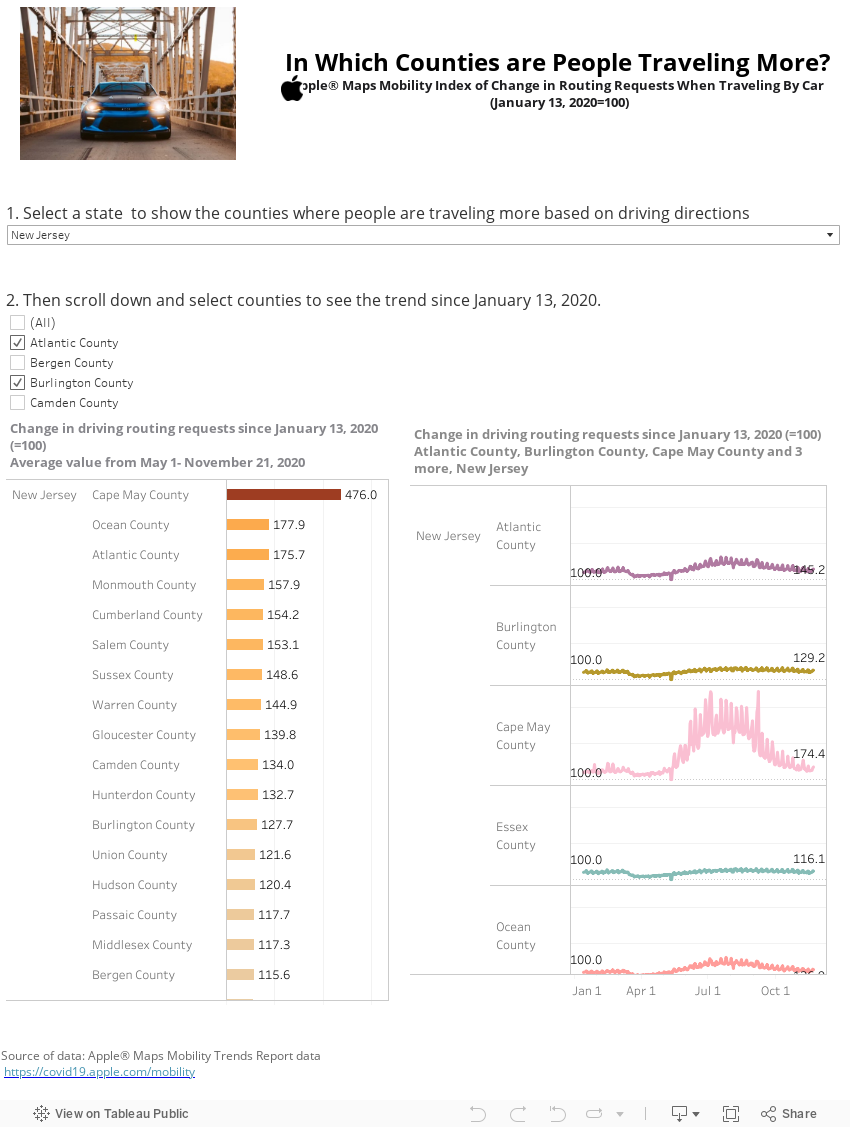
Apple® Maps Daily Mobility Trends Report Show More Mobility and Traveling in Smaller Cities and Counties
There are several indicators that point to the rise of the suburbs and small towns, for now. A daily indicator that points to the greater economic activity arising from greater mobility is the Apple® Maps Mobility Trends index. The index is based on requests for route changes relative to January 13 (base= 100).
City and county-level data indicate that smaller cities and counties away from the counties where the top tier cities also had a lot of route requests, indicating that many people were traveling to and from these areas. I calculated the average of the index from May 1- November 11. There is a huge increase in the request for directions in counties that tend to be summer destinations. There is no index in past years so it’s hard to compare if this same increase happens every year. But the data on rising home sales in the suburbs and small towns and vacation sales indicate that the travel to these areas was not just seasonal but that travel to and demand for homes in these areas rose as a result of the pandemic as people escaped the cities and also found leisure in outdoor activities. The ability to work from home provided greater opportunity to stay in these areas and perhaps scout for a home.
More traveling in smaller cities than in larger cities
The data shows the there is still a decline or just a mild recovery in road travel in the primary cities compared to the secondary or tertiary cities. In San Francisco, the level of travel by car is 15% less than in January (85); in Los Angeles, the level is just about the same (100); in Washington, D.C., the request for direction changes of people traveling by car is just a tad higher (105), and in New York, the level of request or route changes using AppleMaps 10% higher (110).
On the other hand, the request for route changes is much higher in the small cities such as Colorado Springs (152), Fort Wayne (152), Virginia Beach/Norfolk (150, 141), Boise (150), Spokane (148), Bakersfield (147), Tacoma (139), Memphis (138), Greenville, SC (138), New Haven (137), Indianapolis (137), and Salt Lake City (136), among other cities.
More traveling in counties with summer destinations
In the state of New Jersey, Cape May County had the most requested route changes—a whopping index of around 1,000 from June to August or an increase of 100x the level in January. This index did not exist last year so it is hard to compare if this is just due to seasonal variability. However, these 1,000 levels are several multiples better than the city-level indices.
In New York, the county that had the most requests for route changes were Schuyler County (378), Yates County (325), and Warren County (246). Schuyler and Yates are part of the Finger Lakes region near Ithaca. Warren County is a little bit north of Albany. While these are popular summer destinations, the travel in these areas during the pandemic likely rose several times over as people escaped New York.
In Virginia, the counties that had the most requests for directions on Apple® Maps were Page County (270), Accomack (236), and Nelson County (233). Page County is in the Shenandoah region, Accomack is in the Eastern Share, and Nelson County is between Charlottesville and Lynchburg, flanked by the Blue Ridge Mountains and James River.
In California, Siskiyou County, Del Norte County, Lassen County, Mono County, and Tuolumne County had the most requests for routes. Siskiyou is in the northernmost part of California and borders Oregon, while Del Norte is in the westernmost part of California along the Pacific Ocean and bordering Oregon. Mono County and Tuolumne County are along close to the Yosemite National Park.
1 There were 1,128 respondents in October. About 1,000 respondents report a sale at every monthly survey.