


When a household chooses where to live, it is said that it has already chosen a set of local public goods (schools, parks, and public safety) and a set of taxes to finance the public goods. Based on theories from Urban Economics, people locate across neighborhoods according to their preferences for public goods, social characteristics and other factors (such as job relocation, closer to friends or family[1]). Aside from theories, let’s see where most people moved in 2014 in reality.
A couple of weeks ago the Internal Revenue Service (IRS) made available migration data for 2013-2014 including migration patterns for counties and states[2]. Taking a closer look at the state-to-state migration flows, about one third of the states had more in-migrants than out-migrants. Texas was in the top of the list followed by Florida and South Carolina.
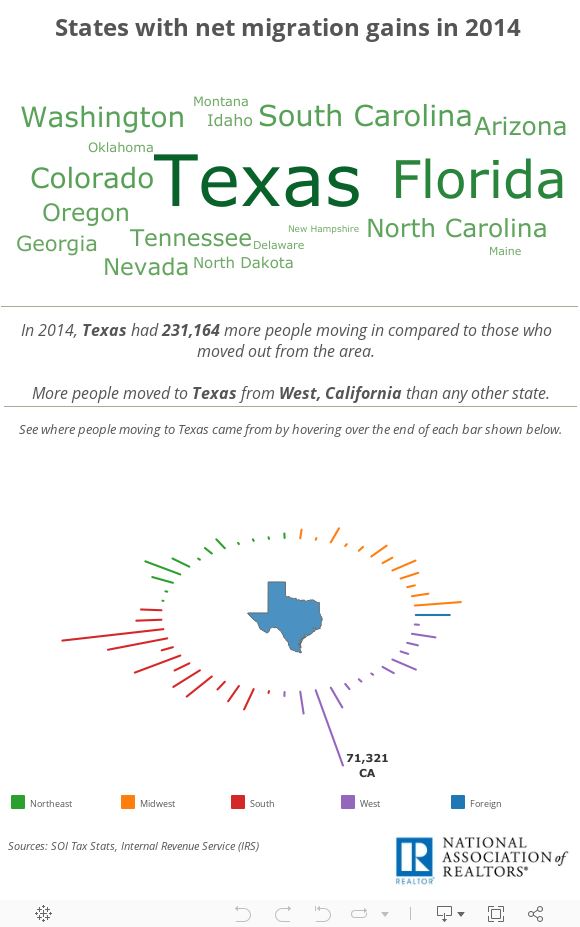
But what does this influx of new residents mean for those local governments?
The IRS reports adjusted gross income figures for both in-migrants and out-migrants. Using these figures as a proxy for total household income, the average income by household was computed for both groups[3]. Comparing the average income of the two groups, the following states seem to have both more and higher income in-migrants than out-migrants: Florida, Nevada, South Carolina, New Hampshire, Montana, Idaho, Tennessee, Arizona, North Carolina, Oregon, Maine and Washington.
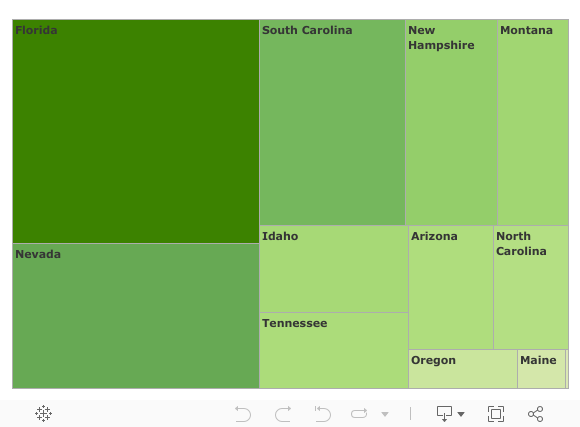
The highest gaps in the average income between the two groups were found in Florida ($27,500), Nevada ($17,800), South Carolina ($14,900), New Hampshire ($9,400) and Montana ($7,200). Without implying causation, this influx of new residents can provide local governments with a substantial boost in their tax base and also the local economy as more people with higher income, and likely higher wealth, moved in those areas.
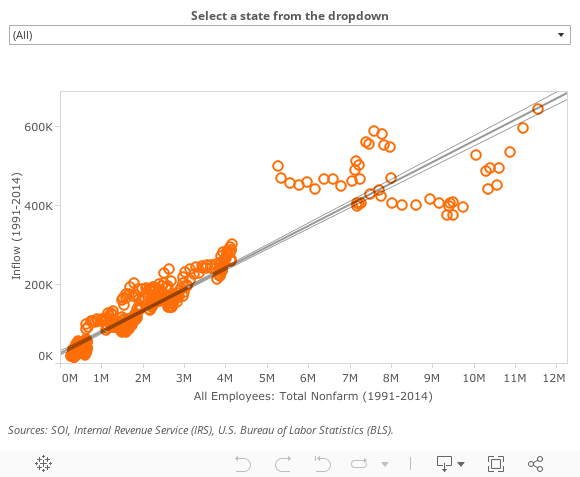
Furthermore, looking at the level of total employment (nonfarm), it seems that the areas with gains in net migration had also gains in job market. While the relationship between migration and employment has many facets, the data showed that more jobs were created in areas with net migration gains in 2014.
[1]Based on NAR’s Survey “2015 Profile of Home Buyers and Sellers”, those are the main reasons for selling previous home and moving 51 miles and further from the previous residence.