


Housing vacancies are currently at the lowest levels since at least 2005, according to the Census Bureau estimates. Nationally, the rental vacancy rate was 7.3 percent while homeowner housing rate was 1.9 percent for the third quarter 2015.
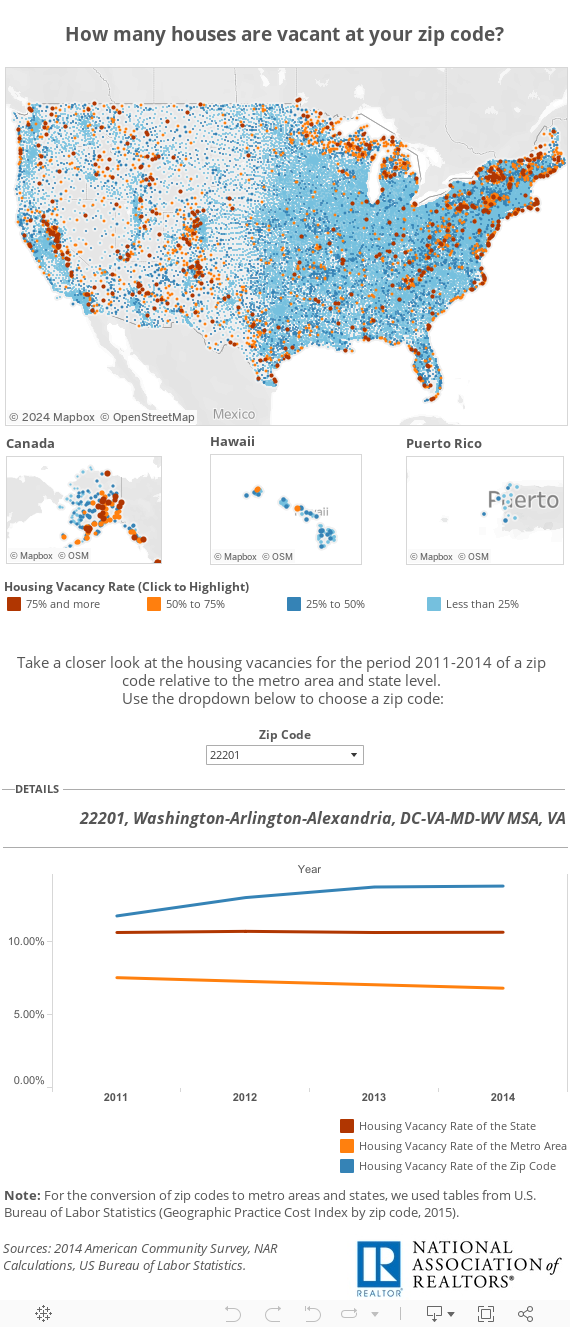
But how did housing vacancy rate[1] change at a local level between 2014 and 2011? American Community Survey (ACS) recently published overall vacant housing estimates for zip codes for 2014. Of the 32,634 zip codes, 79 percent had vacancy rate less than 25 percent, 16 percent had 25 to 50 percent, 4 percent had 50 to 75 percent, and 1 percent had 75 percent and higher. Pennsylvania (8.5% of the housing units) and New York (5.9% of the housing units) had the most zip codes with zero percent housing vacancy rate.
At metro area level, here is a summary of the areas with the lowest and highest housing vacancy rate in 2014:
|
Lowest Housing Vacancy Rate |
||
| Metro Area |
Vacancy Rate
2014 |
Vacancy Rate 2011 |
| San Jose-Sunnyvale-Santa Clara, CA |
4.0% |
4.8% |
| Iowa City, IA |
4.3% |
6.6% |
| Ames, IA |
4.5% |
5.0% |
| Provo-Orem, UT |
4.8% |
5.3% |
| Lancaster, PA |
5.1% |
4.8% |
|
Highest Housing Vacancy Rate |
||
| Metro Area |
Vacancy Rate
2014 |
Vacancy Rate 2011 |
| Ocean City, NJ |
58.4% |
54.5% |
| Barnstable Town, MA |
41.4% |
39.4% |
| Myrtle Beach-Conway-North Myrtle Beach, SC |
38.9% |
38.6% |
| Salisbury, MD |
38.7% |
13.7% |
| Naples-Marco Island, FL |
36.8% |
39.1% |
The lowest vacancy rates are in metro areas with strong job gains and/or too few new home constructions. The highest vacancy rates are in metro areas with many vacation homes.
At state level, the most occupied housing units were located in California while Maine experienced the highest housing vacancy rate in 2014.
Select a zip code below to view housing statistics from 2011 to 2014 relative to the metro area and state level.