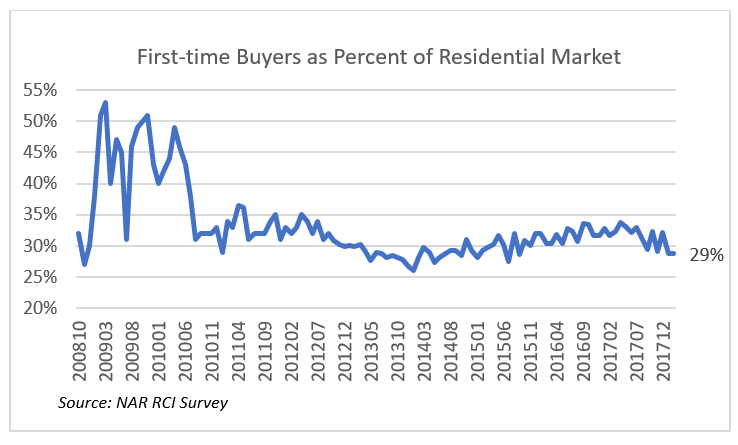
Lack of homes available for sale and the concomitant rise in prices appears to be sidelining many first-time potential homebuyers in 2018. In the first two months of 2018, first-time buyers made up only 29 percent of home buyers compared to 32 percent in the same period one year ago, according to the February 2018 REALTORS® Confidence Index Survey.[1]

The share of affordable properties continues to trend downwards. According to Realtor.com data, 43.8 percent of properties were listed at $250,000 or below in February 2018, compared to 75 percent in May 2012.

Home prices continue to increase in many areas amid lack of supply. The West region has the hottest real estate prices, led by San Jose-Sunnyvale-Sta. Clara, with the median listing price on Realtor.com, at $1.2 million in February 2018, up 26.4 percent from one year ago. The median home price is more affordable in Seattle-Tacoma-Bellevue, with the median list price at $527,520, but listing prices in this area have also been rising strongly, 29 percent in February 2018 from one year ago.
Even in states with comparatively high property taxes, listing prices are still rising. In New York-Newark-New Jersey, listing prices were up by 14 percent in February 2018 compared to one year ago. Listing prices were also up in the Northeast region metro areas of Massachusetts, Rhode Island, and Connecticut.
Use the data visualization below to check out the prices across metro areas based on Realtor.com data.[2]
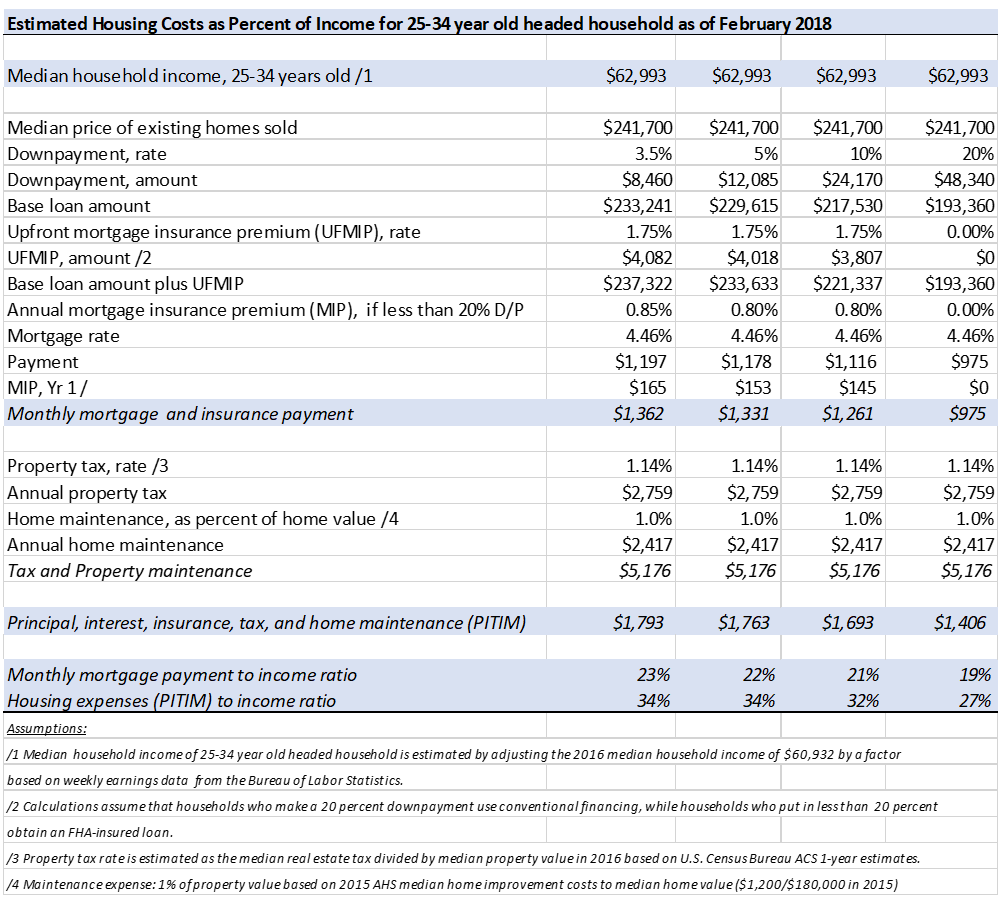
Amid rising home prices, first-time buyers are likely finding it hard to make a home purchase. Table 1 below shows the principal, interest, taxes, mortgage insurance, and home maintenance (PITIM) payments at various down payment levels, and the share of these housing costs to the typical household income of a 25 to 34 years old-headed household, at $62, 993.
At 3.5 percent downpayment, the monthly mortgage debt-to-income ratio is about 23 percent. Adding on other housing expenses for mortgage insurance, taxes, and maintenance, the share of housing costs to income rise to 34 percent of income, exceeding the 30 percent threshold that characterizes cost-burdened households. With a 20 percent downpayment, the share of housing costs to income decreases to 27 percent, but this means making a larger downpayment of $48,340, which may be a hurdle to meet for young households who may also be paying student debt and who do not yet have this level of savings. According to the Federal Reserve Board’s 2016 Survey of Consumer Finances, the average savings of non-homeowners was $5,200 in 2016.[3]

[1]NAR’s 2017 Home Buyers and Sellers Report (HBS) reported the share of first-time buyers at 34 percent. The HBS report is survey of homebuyers who purchased the home for primary residence, while the NAR RCI Survey is a survey of REALTORS® who reported sales for primary and non-primary residential use of the buyer.
[2] Realtor.com data is freely available to the public at https://www.realtor.com/research/data/.
[3] Relaxed gifting standards within reasonable underwriting guidelines can also make a home purchase more affordable. For example, Fannie Mae allows all the down payment for one-unit principal residence property mortgages with loan-to-value of greater than 80 percent (or down payment of 19 percent or less) to come from eligible givers (persons related by blood or marriage, fiancé, fiancée, or domestic partner.[3] Freddie Mac allows gifts/grants after the borrower puts in a three percent down payment.[3] The Federal Housing Administration allows the 3.5 percent down payment to come from acceptable donors (relatives, employer, friend, charitable organization, government agency) for borrowers with credit score of at least 620. However, if credit score is between 580 and 619, the down payment must be the borrower’s own money (required minimum investment). The builder, seller, or an associated entity to the transaction may not provide gifts.


