


2020 will go down in history for a pandemic that changed the world. No one would ever have imagined last year that we would stay home for social distancing in order to help save lives. Specifically, one in three adults substituted some or all of their typical in-person work for telework compared to 1 in 20 adults that worked remotely before the pandemic. With teleworking at record high levels, people also decide to move for various reasons. Some of them seek out bigger houses with bigger yards for their kids to play in and office space for them to work. Others seek more affordable homes in less dense places away from large city centers since they can telework.
While teleworking may continue long after the pandemic, it is obvious that far fewer people are moving for job-related reasons during the pandemic than they used to do pre-pandemic.
To better understand the COVID-19 impact on U.S. mobility, we collected United States Postal Service® change-of-address data from March to October 2020 for each county across the United States. Since people who want to forward their mail from their old home to new residences file a change of address request to the USPS®, this dataset serves as a good proxy on how many people moved since the beginning of the pandemic.
Findings
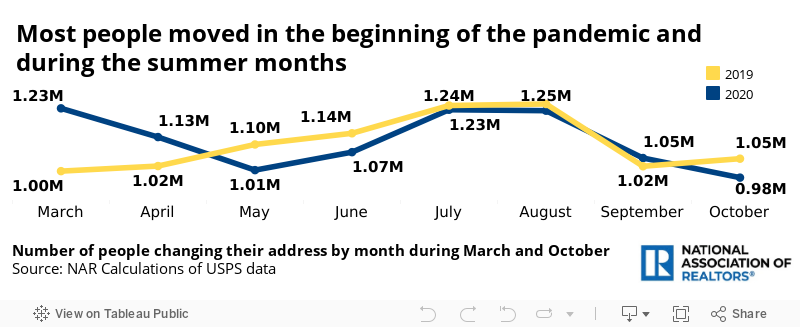
Most people moved in the beginning of the pandemic and during the summer months
As of October, 8.93 million people relocated since the pandemic started. This is an increase of nearly 94,000 people changing the address of their residence compared to 8.84 million in 2019 during the same period (March through October). Breaking down the data by month, most moves during the pandemic occurred in March, with 1.23 million people relocating compared to 1.00 million a year earlier.
Taking the analysis one step further, we tracked the location of these movers at state and county level. First of all, at the state level, after comparing inflows and outflows for the period of March to October 2020, 34 states experienced net migration gains across the country. This means that these states had more people moving in to the state compared to those who moved out. Although interstate migration accounts for less than one-fifth of all moves, this type of move is worth considering because of its important implications for regional demographics and economic change.
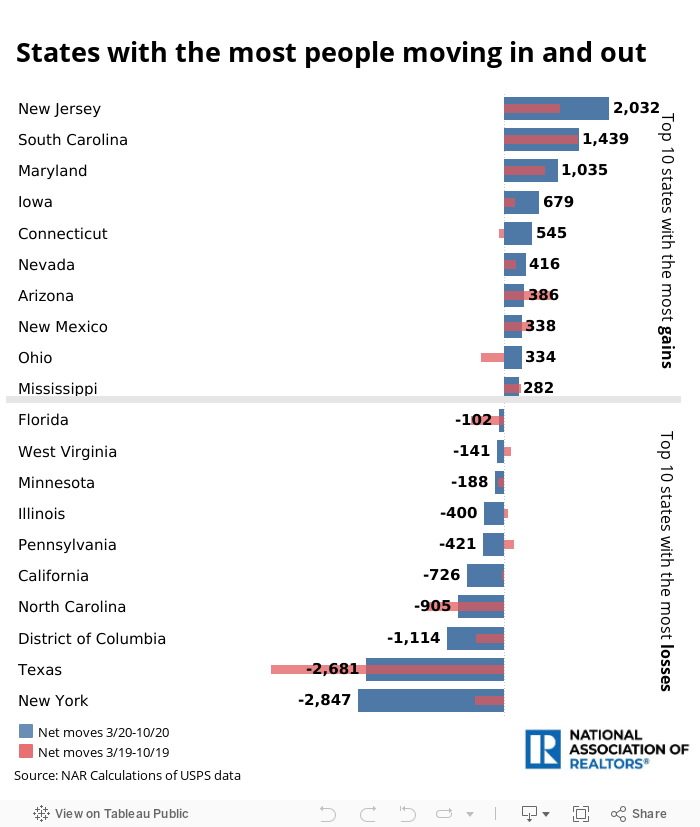
New Jersey, South Carolina and Maryland were the winners with the highest migration gains across the country. Specifically, in New Jersey, 2,032 more people moved in to the state compared to those who left. In contrast, New York, Texas and the District of Columbia were the states losing the most people during the pandemic. In New York, 2,847 more people moved out from the state compared to those who moved in. However, keep in mind that the data is not a full year comparison. A 12-month comparison will be a better read about the true migratory trends. For example, we know that Texas always draw more new residents to the state every year, but the period covered is over several hot summer months where Texans may go elsewhere to escape the heat, and therefore shows a net negative trend in the data set.
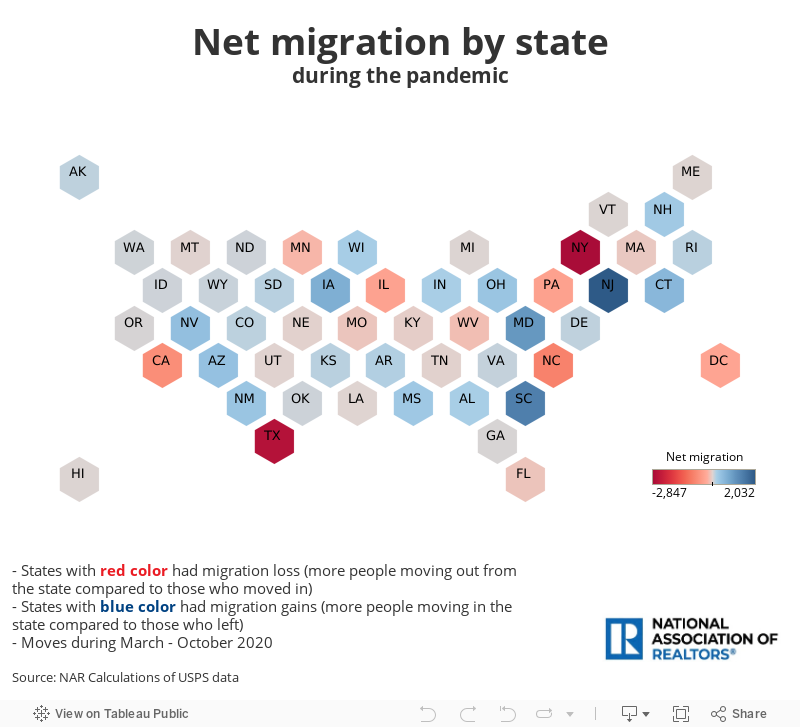
However, a single number may not tell the whole story. Thus, for our analysis, we also compared the net migration for each state during the pandemic with the pre-pandemic levels. Specifically, we compared the inflows and outflows during March and October in 2020 with those in 2019. We found out that, for instance, Texas lost much fewer people during the pandemic than a year earlier. With Texas one of the most populous states in 2019 in terms of population size, Texas lost nearly 2,700 people during March and October of 2020 compared to about 4,550 during the same period in 2019. However, New York lost more people during the pandemic. During March and October of 2020, New York lost nearly 3,000 people compared to about 600 people a year earlier. This reflects the negative effect of the pandemic in New York with more people leaving the state.
Nevertheless, we see states with a declining population size in 2019 experiencing the highest migration gains during the pandemic. For instance, while the population declined by 0.3% in New Jersey in 2019, New Jersey gained more people during the pandemic. During March and October of 2020, New Jersey gained nearly 2,000 people compared to 1,100 a year earlier. Thus, we should expect significant shifts in population due to the pandemic.
Compare net moves between 2020 and 2019 for the top 10 states with the highest gains/losses during the pandemic:
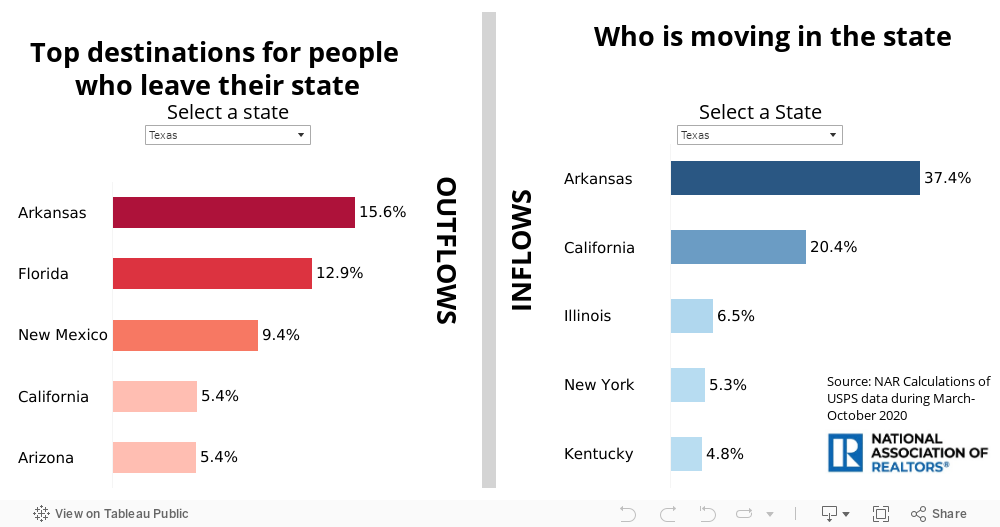
While Texas and New York had the highest moving rates, the chart below shows where most of these movers relocated during the pandemic. For instance, more than 50% of those who left New York moved to New Jersey followed by Connecticut (12%). Respectively, the top three destinations for Texans during the pandemic were Arkansas (16%), Florida (13%) and New Mexico (9%).
Most people moved close to their home with the suburbs gaining most movers during the pandemic
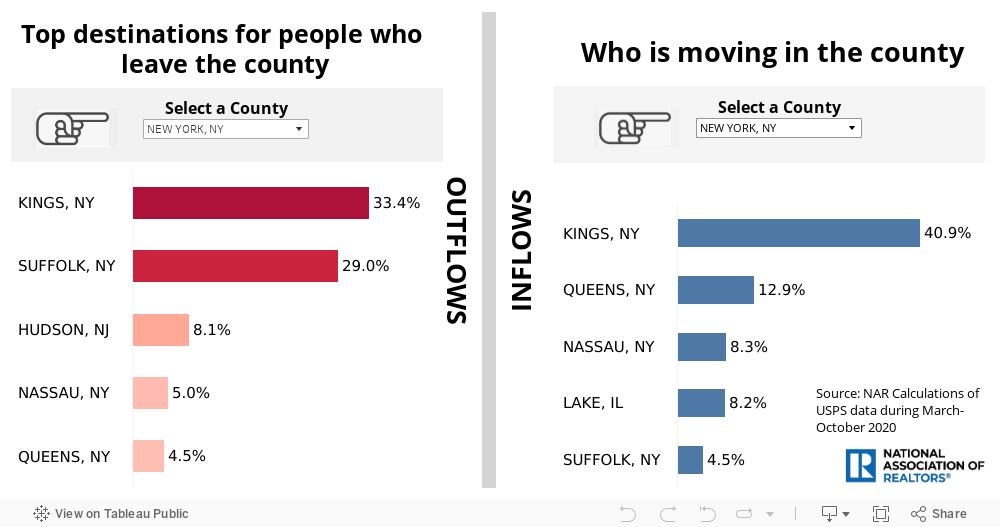
According to USPS data, large cities lost the most people during the first seven months of the pandemic. Specifically, we see people moving out of some of the country’s most popular areas and relocating to the suburbs. This means that most people moved close their home. For instance, most New Yorkers moved to Brooklyn (33%), Hamptons (29%) and Jersey City (8%). Respectively, most San Franciscans moved to a county in a radius of less than 60 miles away from their previous home.
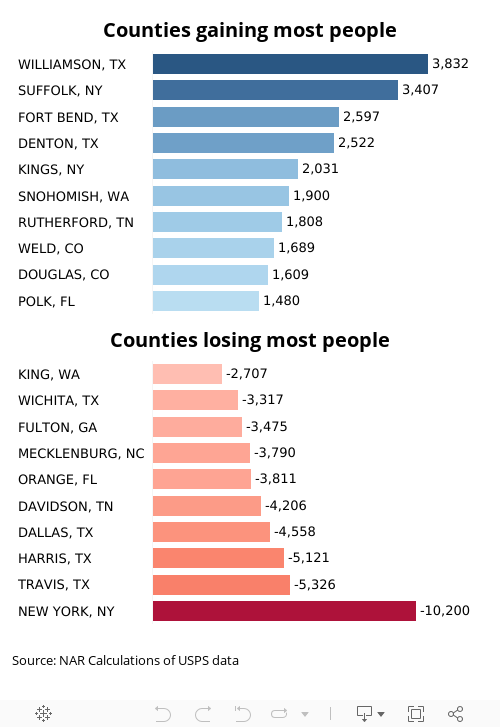
As a result, counties near big cities are experiencing the most migration gains. For instance, Williamson County in Texas was the county with the highest migration gains across the country. While Williamson County is also one of the most conveniently located suburbs in Austin, nearly 4,000 more people moved in the county compared to those who moved out. Specifically, nearly 6,100 people moved in Williamson County, TX while about 2,250 people left from the county. Another example is Suffolk County in New York, which gained nearly 3,400 people during the pandemic. In contrast, New York County in New York, Travis, Harris and Dallas Counties in Texas lost the most people.
See the top 10 counties with the highest migration gains/losses during the pandemic:
See the origin and destination of movers for each county across the country:
Expect similar migration patterns for 2021
There are very promising new developments on the COVID-19 vaccine, with vaccine distribution starting in the next couple of weeks. However, experts do not predict that we’ll return to our pre-pandemic sense of normal until late 2021. In the meantime, many large companies have already announced that employees can work remotely long-term even after the pandemic. Thus, expect similar migration patterns for the first six months of 2021 and even longer with suburbs and smaller cities gaining more population.
