


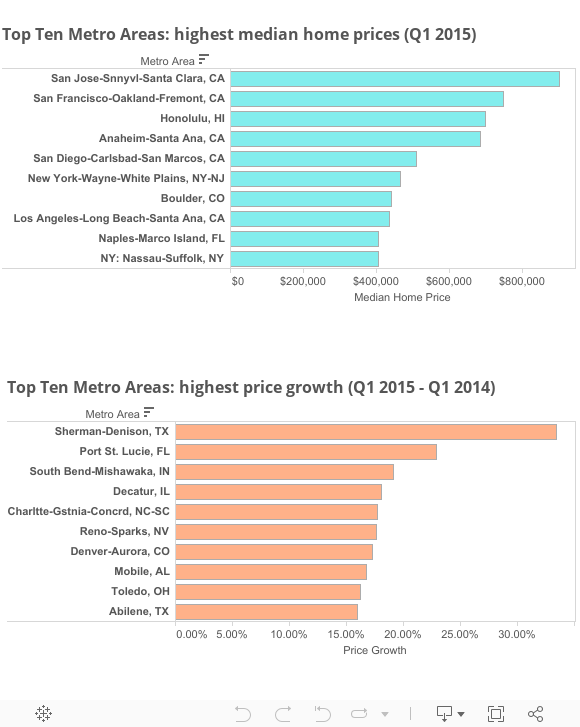
Across the country, home prices rose in the first quarter 2015 compared to the same period in 2014. Stronger demand amidst lagging inventory levels caused home prices to accelerate in most of the metropolitan areas. From a sample of 174 metropolitan areas, 85% of them experienced an increase of home prices while 14% had a decrease.
Here is the list of the metropolitan areas which were at the top:
Visualization 1
https://public.tableau.com/profile/national.association.of.realtors#!/vizhome/LMR-Q12015/Dashboard1
When home prices increase in most of the metropolitan areas, people ponder whether the value of their house increased more or less than in other locations. Comparing with the prices of the first quarter 2012 and 2008, we see that the metropolitan areas below had the highest gains[1] in prices during the last three and seven years, accordingly:
Visualization 2
https://public.tableau.com/views/LMR-Q12015/Dashboard2?:embed=y&:showTabs=y&:display_count=yes
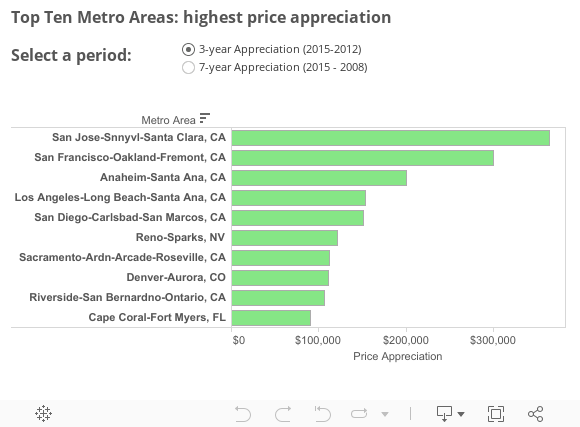
Based on the chart above, we see that the list of the top ten metro areas with the highest price appreciation changes when we select three years period and then seven years period. This means that the “right” time to buy or sell your house differs from metro area to metro area. Of course it is impossible to know the exact “right” time to buy or sell a home. This likely explains why data from the 2014 Profile of Home Buyers and Sellers shows that affordability of homes ranks 6th on the list of primary reasons why people purchase a home and 3rd on the list of primary reasons for the timing of a home. The buyer’s desire or readiness to own a home was the number one reason for the purchase and for the timing.
Where does your metro area stand? For more information on recent trends in your metro area, see the Local Market Reports for the first quarter of 2015.
[1] Note: Equity gain reflects price appreciation only.