


")


Want a quick picture of what’s really going on in your local housing market?
Tuesday, the National Association of REALTORS® debuted what will likely become a go-to resource for real estate professionals looking to access a snapshot of key market conditions—all in one place and searchable by metro area.
The NAR Metro Market Statistics Dashboard is available exclusively to NAR members and includes regularly updated information on housing affordability, home prices, sales activity, listing trends and more.
“The new dashboard enables NAR members to stay ahead of the market and better serve their clients,” says NAR Chief Economist Lawrence Yun. “Using exclusive NAR data, the dashboard is a one-stop-shop that equips members with insights into shifts in affordability, demand and the economy. This allows agents who are REALTORS® to advocate on behalf of their clients with confidence and achieve better outcomes.”
The dashboard is updated with new data monthly for more than 200 metro areas across the country. NAR members can find key metrics such as:
- Housing affordability shifts
- Sales and listing activity
- Home pricing trends
- Economic indicators that could be influencing the market
- Homeownership and demographic data
Digging Deeper Into Metro Data
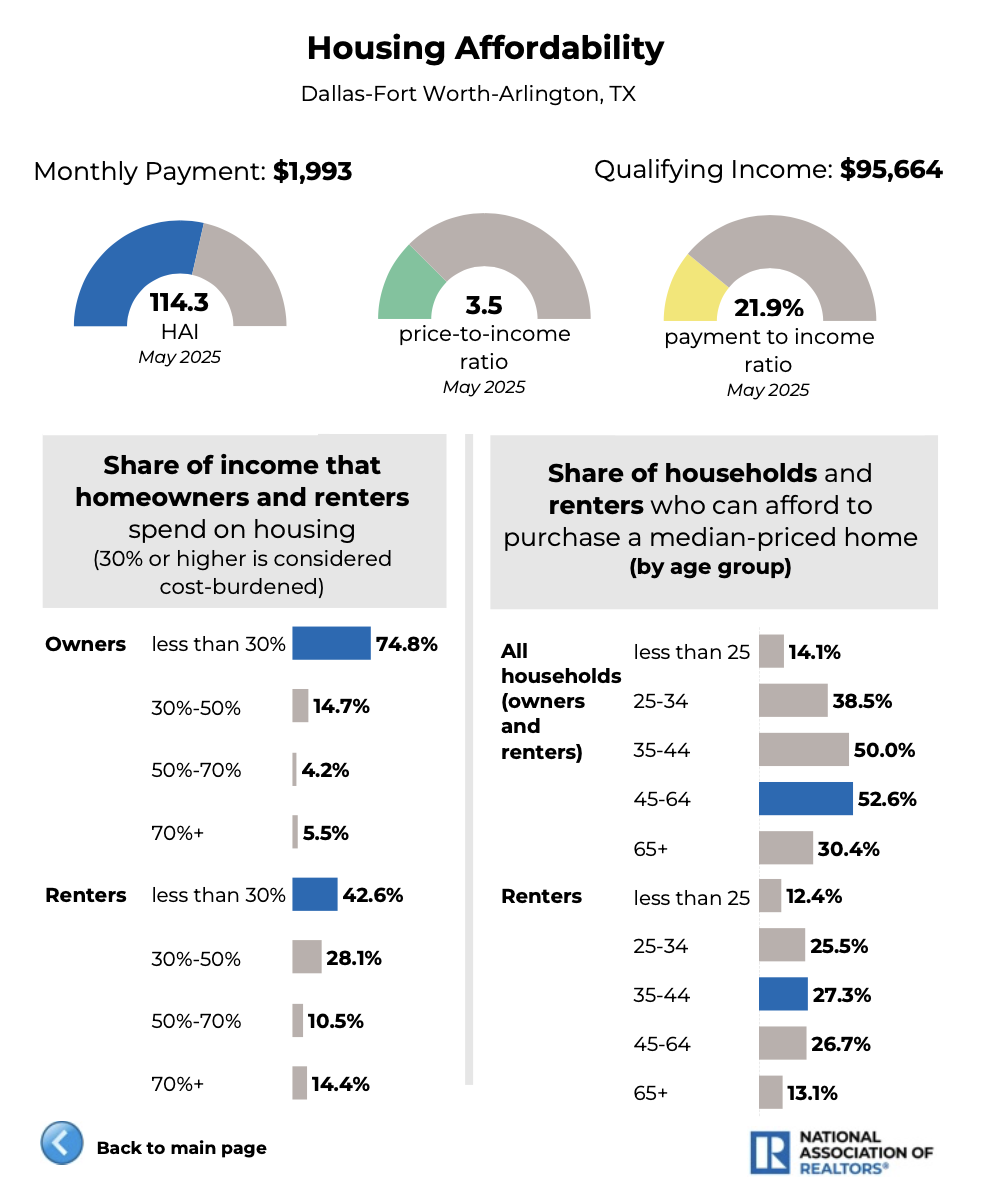
The interactive dashboard offers members access to the latest economic conditions—such as job and wage growth in their area—as well as charts on median home price growth, housing construction, the share of income that homeowners and renters spend on housing, average monthly payments and more.
Members can use the data to download custom charts for use in their newsletters, social media and listing presentations.
Here’s an example of some of the data the dashboard reveals for one metro area—Dallas-Fort Worth-Arlington, Texas—on just one metric of housing affordability.
The dashboard also can be used to compare metro areas to national housing trends. For example, NAR’s data shows that if mortgage rates—which have been blamed for a sluggish home sales season lately—dropped to 6%, an additional 5.5 million households including 1.6 million renters could have the income needed to purchase a median-priced home. NAR’s newly released dashboard reveals that some metro areas would fare better than others if mortgage rates dropped to 6%—particularly Atlanta, Dallas, Minneapolis, Cleveland and Kansas City.
Yun will demonstrate the new NAR Metro Market Statistics Dashboard—and share his midyear housing forecast—during the Real Estate Forecast Summit. The webinar takes place on Wednesday, July 16, 2–3 p.m. ET. Register here.