

")


Please note: The data visualization embeds on this page are best viewed on a laptop or desktop computer.
"Initial unemployment claims" refer to the number of new jobless claims filed by U.S. workers seeking unemployment benefits. Initial claims offer national and state-level estimates each week. As a result, this data serves as a good indicator of new layoffs and provides early signs of changes in the economic cycle.
In the week ending August 9:
- The total number of initial claims was 199,186, representing a 1.9% increase from the previous week.
- In the same week in 2024, there were 200,845 initial claims.
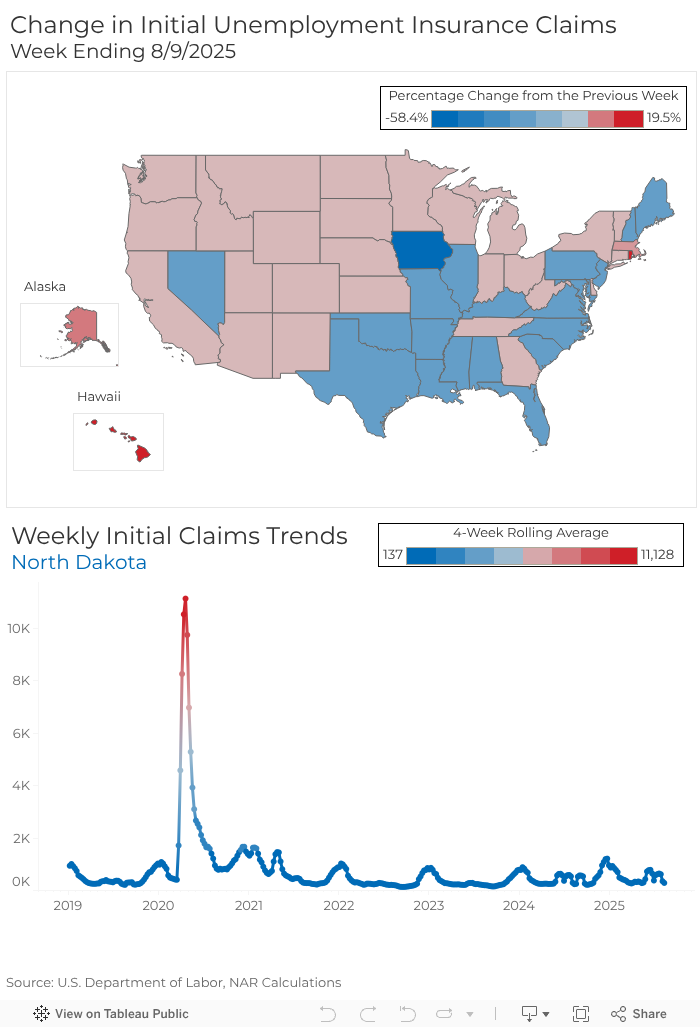
- Compared to the week before, initial claims decreased in 21 states and the District of Columbia, with Iowa (-32.5%), Alabama (-10.6%), and Virginia (-8.8%) seeing the largest drops.
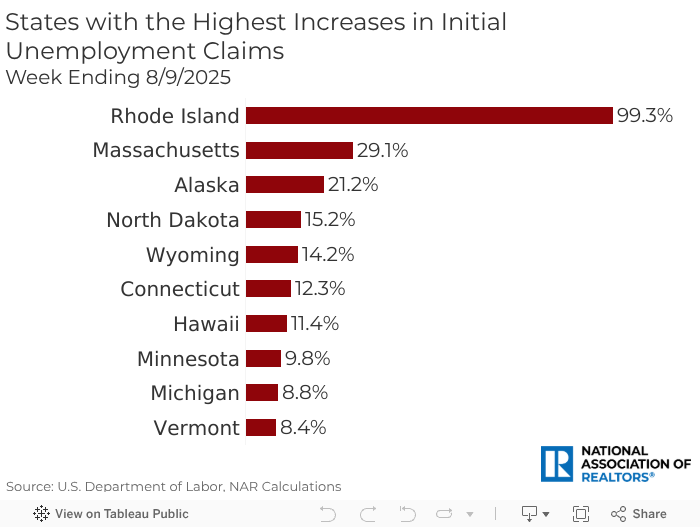
- The states with the biggest increases in claims were Rhode Island (99.3%), Massachusetts (29.1%), and Alaska (21.2%). However, compared to July’s unemployment claims data, initial claims are rising more slowly.
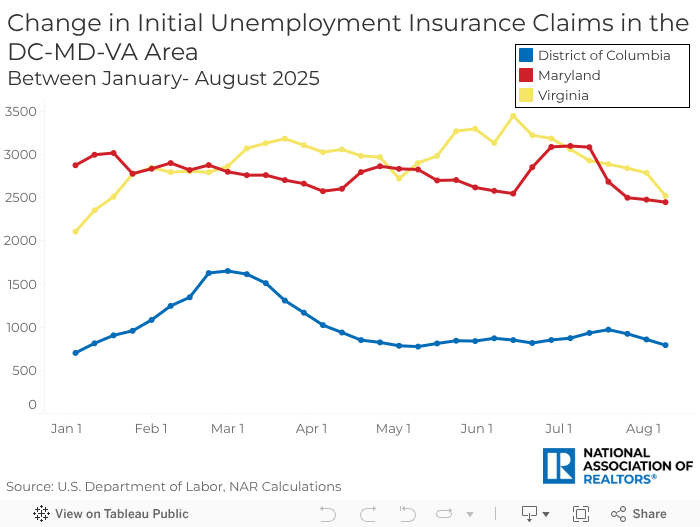
- The four-week average of initial claims shows a general improvement in the DC-Maryland-Virginia (DMV) area, with declines of nearly 9% in Virginia and nearly 1% in both Maryland and the District of Columbia.
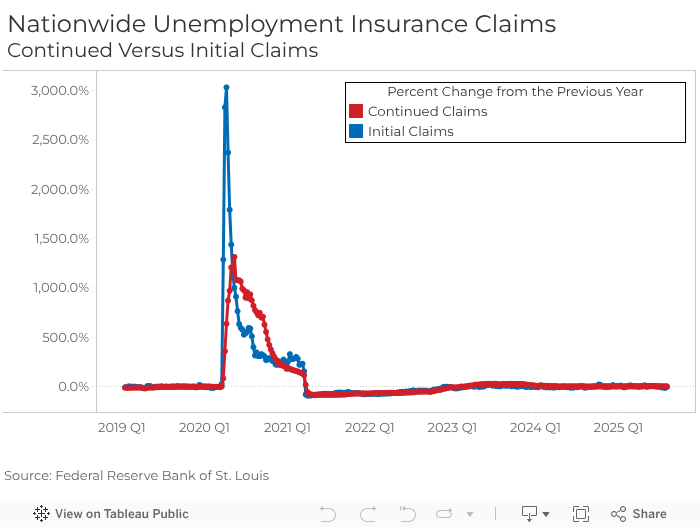
Along with initial claims, NAR has been monitoring "continued unemployment claims," which count the number of people still receiving unemployment benefits after filing their first claim. Unlike initial claims, this data indicates long-term unemployment. For the week ending August 2, continued claims increased by 4.8% compared to the same week last year, while initial claims decreased by 3.0% year over year.
Unemployment insurance claims offer valuable insights into the overall health of the economy, as they are among the timeliest indicators of the U.S. labor market. From a broad economic perspective, we are beginning to see the effects of ongoing unemployment on the labor market, with the unemployment rate slightly rising from 4.1% to 4.2% in July.
According to the Bureau of Labor Statistics, the number of long-term unemployed individuals (those who have been unemployed for 27 weeks or more) increased to 1.8 million in July, making up nearly 25% of all unemployed individuals. However, it’s important to note that the unemployment rate has remained essentially unchanged, in the range of 4.0%-4.2%, since May 2024, and that payroll employment data is a lagging indicator.
To see how unemployment benefits have changed in your market, select a state on the map below:
Advertisement

Anat Nusinovich
Anat Nusinovich is an economist for the National Association of REALTORS®.