


")


Anat Nusinovich
Anat Nusinovich is an economist for the National Association of REALTORS®.
According to newly released data from the U.S. Census Bureau, the number of people who moved between states rose from approximately 7.9 million in 2021 to approximately 8.2 million in 2022. Evidence on domestic moves (moves that occur within the United States and don't include moves from abroad) allows us to identify popular markets and why people choose to move there.
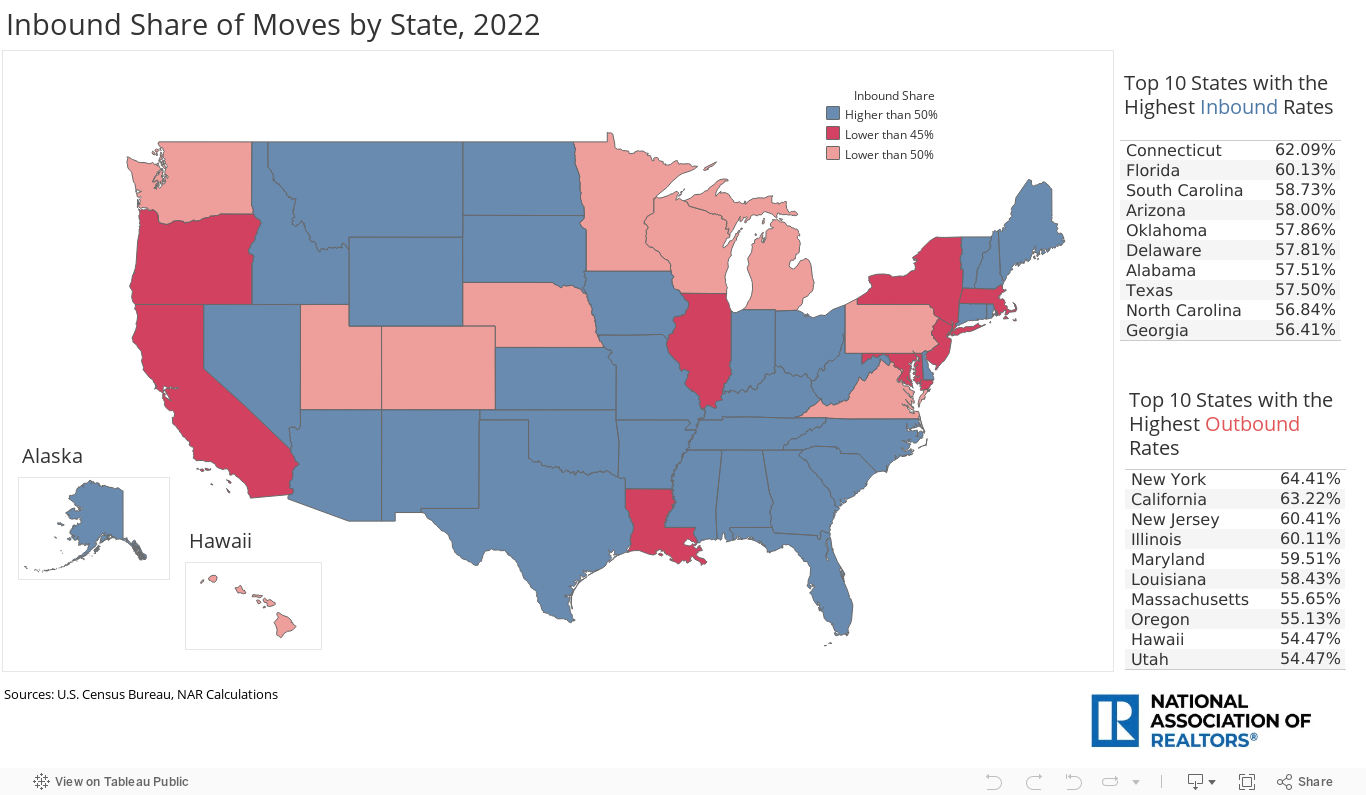
Thirty-two out of the 50 states had an inbound moving rate higher than 50% in 2022. Inbound moving rate is defined as the number of people moving into a state as a share of the state's total number of movers. Connecticut (62.09%) had the highest inbound moving rate, with most people moving from neighboring states, such as New York, Massachusetts, and New Jersey. The data shows a different case for large states by population, like Florida (60.13%), where the largest share of people moved from New York, California, and New Jersey.
Nine out of the 50 states (including the District of Columbia) had an outbound rate higher than 50%. Outbound rate is defined as the number of people moving out of a state as a share of the state's total number of movers. At the top of the list are large states like New York (64.41%), California (63.22%), New Jersey (60.41%), and Illinois (60.11%), all of which had outbound rates higher than 60%. New Yorkers moved to warmer states like Florida or more affordable states where they can still commute to work, like New Jersey. In contrast, Californians moved to the states where the tech industry has been booming since the pandemic, like Texas and Arizona. People from New Jersey and Illinois moved to either Florida or their neighboring states.
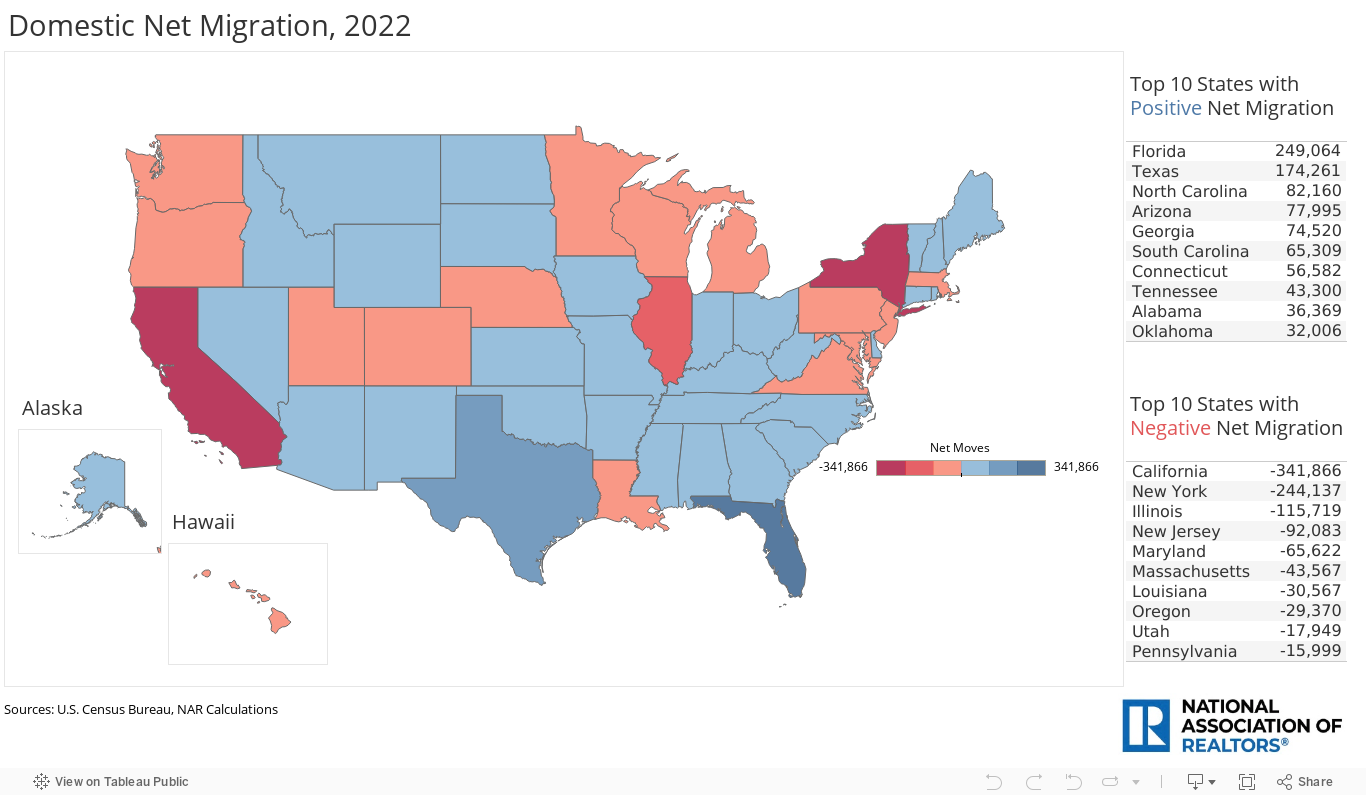
Net migration is defined as the difference between inbound and outbound moves in each state. Florida (249,064) and Texas (174,261) were also leading in positive net migration, while California (-341,866), New York (-244,137), Illinois (-115,719), and New Jersey (-92,083) had significantly negative net migration in 2022. It's important to note that even though California gained many movers, more people left the state than moved into it. Other states that performed positively in the domestic migration front included North Carolina (82,160), Arizona (77,995), Georgia (74,520), and South Carolina (65,309).
A state's net migration is affected by population size, median property value, building permits issued, and jobs created over the year. Our analysis shows that more affordable housing is the most important factor in people's decision to move. In addition, larger states by population saw positive net migrations and had more building permits issued.
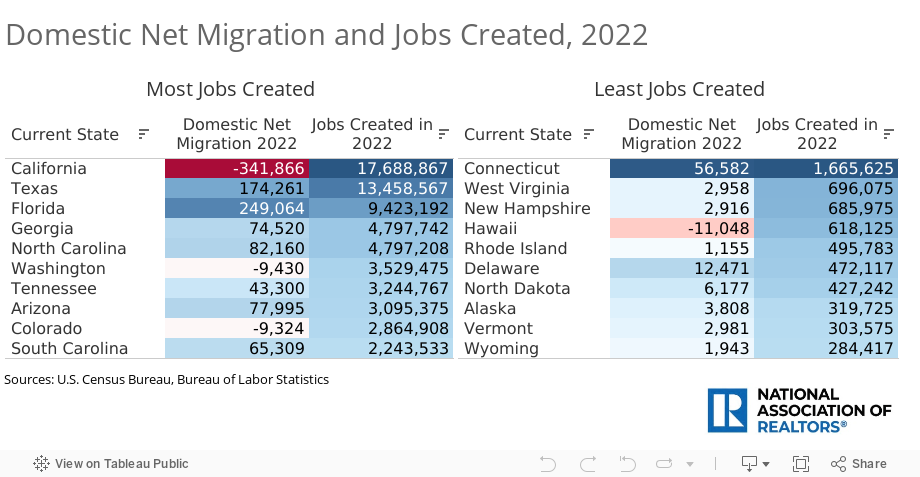
Surprisingly, it looks like employment opportunities were not enough to convince Americans to move to a different state. Our results show an inverse relationship between a state's net migration and the number of jobs created in the same year. This could mean that people are willing to give up on employment opportunities or stay with their current employer when they move to a new state. States that created more jobs in 2022 saw more outbound migrations, most notably California, New York, Illinois, and Pennsylvania. Of course, there is the exception of states like Texas and Florida, which had high net migration rates and many newly created jobs.
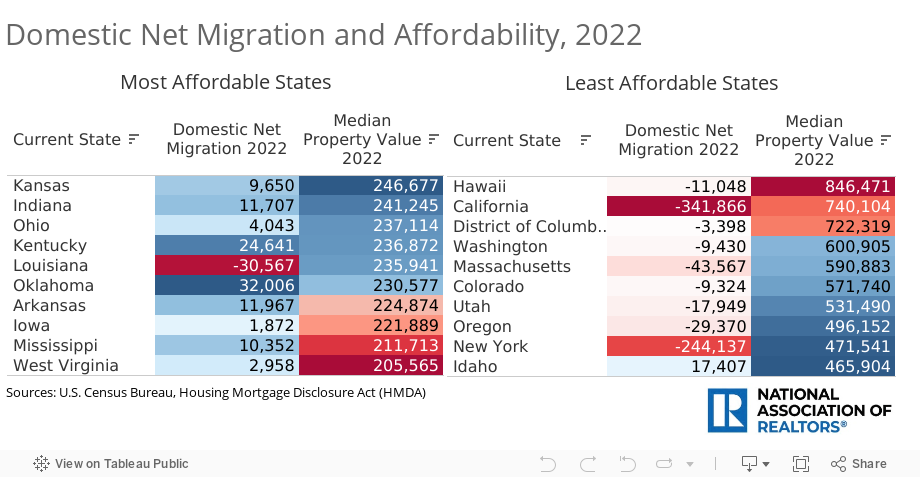
What matters to movers the most is housing affordability in the destination state. States with higher median property value had fewer people moving into them in 2022. In fact, states with the highest property values—Hawaii ($846,470), California ($740,140), and the District of Columbia ($722,318)—all experienced net migration losses, with California losing the most people that year. These are crucial results, as they indicate that people would be willing to compromise on employment opportunities to move to a place where they can afford to buy housing.
Anat Nusinovich is an economist for the National Association of REALTORS®.