


Every year, transactions and prices tend to be above-trend in the summer while activity typically slows down in the winter. Seasonality plays an important role in the housing market since it has an impact on the housing demand and supply. In this post, we exclusively look at the (raw) non-seasonally adjusted numbers for existing home sales and prices to compute the extent of seasonality across the United States.
Since 1999, the National Association of REALTORS® has been releasing the existing home sales activity and prices each month. The statistics are accompanied by announcements which indicate the prior month’s activity:
“Total existing-home sales, which are completed transactions that include single-family homes, townhomes, condominiums and co-ops, increased 1.9 percent from October to a seasonally adjusted rate of 5.22 million in November.”
These headline figures are seasonally adjusted figures and are reported in the news. However, using the example above, this was not the actual number of sales in November but the number of sales after adjusting for seasonality. For everyday practitioners, simple raw counts of home sales are often more meaningful than the seasonally adjusted figures. The raw count determines income and helps better assess how busy the market has been.
NAR releases both the seasonally and non-seasonally adjusted estimates. Let’s take a closer look at the non-seasonally adjusted figures. The visualization below allows you to see the number of sales and level of prices for the last 19 years.
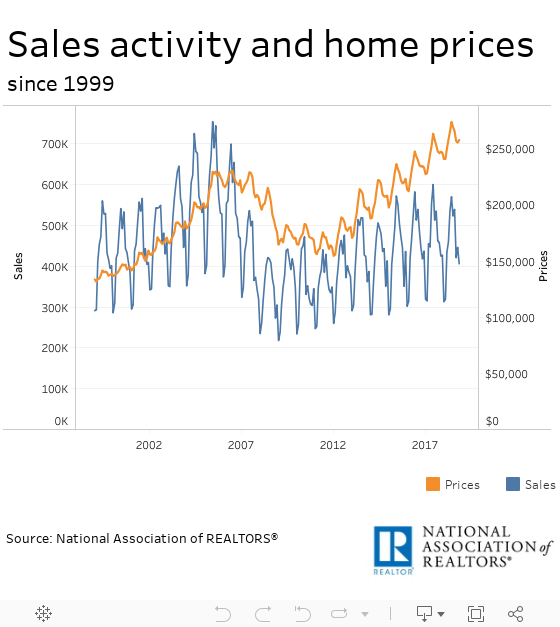
Both sales activity and prices follow the same trend. The number of home sales increases significantly in the spring season. Specifically, sales activity between February and March typically increases by 34 percent while prices rise by 3 percent. Sales continue moving upward in the following months, but it is interesting to see that the busiest home selling months are May, June, July and August. The average number of transactions during this four-month period is 2.1 million and accounts for 40 percent of the annual sales volume. Among these four months, June is typically the peak month of home selling activity.
In contrast, the slowest months of selling activity are November, December, January and February. When we compare the sales in the peak season with the activity in the slow season, we see that the total number of sales in the slow season accounts for 68 percent on average of the total activity in the peak season. For instance, the total sales volume was 2.2 million during May 2017 – Aug. 2017 while the number of sales was 1.5 million during Nov. 2017 - Feb. 2018. Among these four months, January is typically the slowest month of home selling activity.
Demand and mobility are highest in the summer, as the data on existing home sales indicate. It seems that homebuyers tend to move in the summer, and especially for renters who buy, they are even more likely to move at that time. For households with school-aged kids, the reasons of moving in the summer are obvious—it is a traditional time to move to new school districts. Nevertheless, while mobility trends are self-reinforcing, we see that households without kids tend to move in the summer as well.
Regional Seasonality
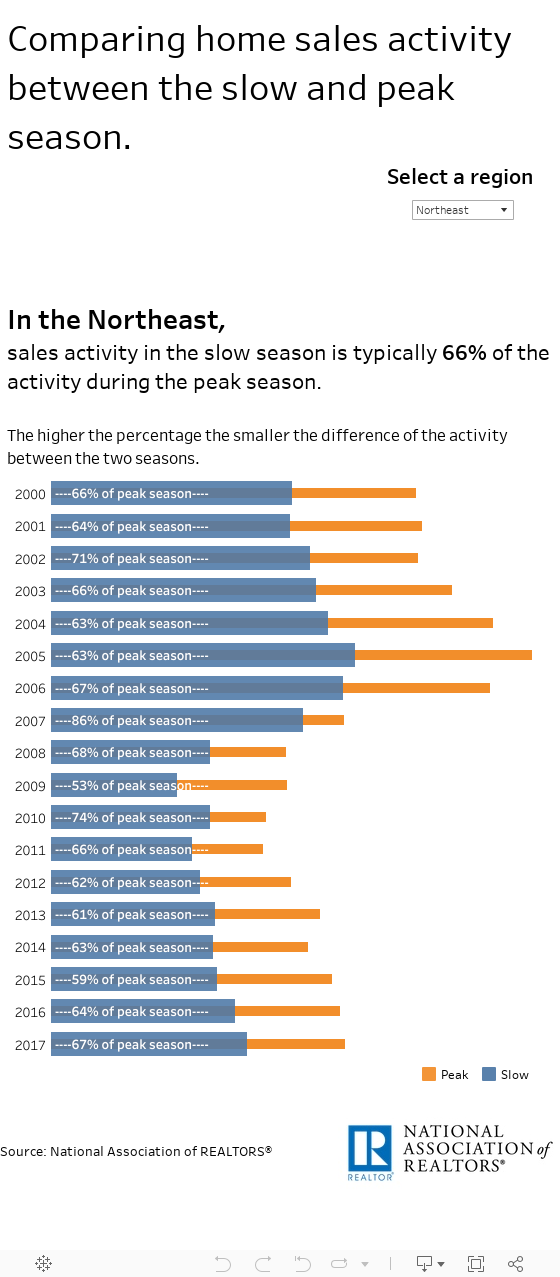
However, the seasonality of a market varies from location to location. It is very interesting to see that selling activity in Midwest and Northeast gets much busier in the peak season than in any other region in the United States. For instance, in the Midwest, sales in the slow season account for 60 percent of the sales in the peak season compared to 71 percent in the West. In 2009, all regions experienced the highest effects of seasonality. For example, in the Northeast region, sales in the slow season were half of the sales in the peak season. The visualization below compares the sales activity between these two periods for all four regions.
Thus, the housing activity early in the year provides clues about the rest of the year. If the activity in the slow, winter months is higher than last year’s activity, then this should suggest that existing home sales activity might be busier during the peak season as well.