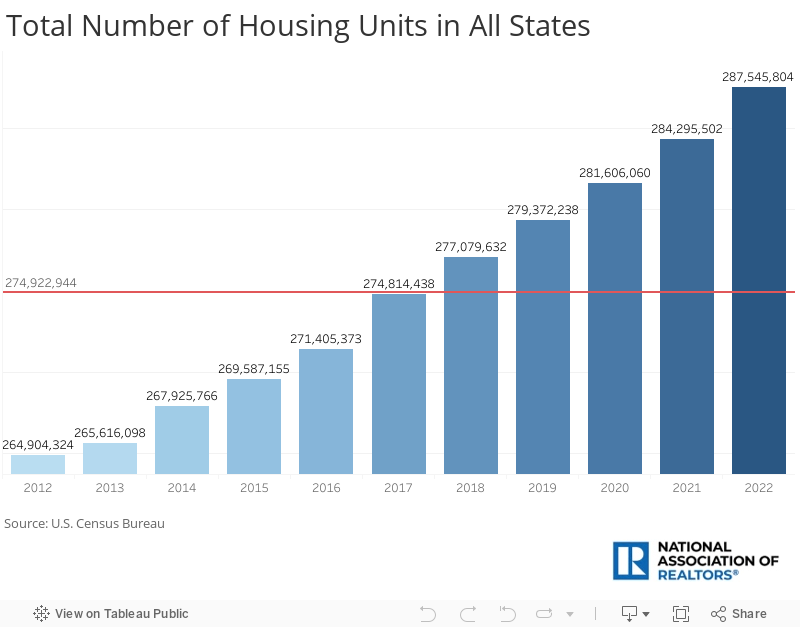
The number of housing units in the U.S. rose by 11.3 million (or 8.5%) between 2012 and 2022. This corresponds to the growing demand for housing. However, there is still a gap to fill. According to recent metrics, housing inventory (active listings) is still limited, and major metropolitan areas are still experiencing high to moderate housing shortages. NAR computes the housing shortage by tracking the number of building permits issued and the number of jobs created in large metro areas. However, the number of permits gives information only on how many housing units are planned to be built. This analysis aims to show housing production at the state level in the last decade.
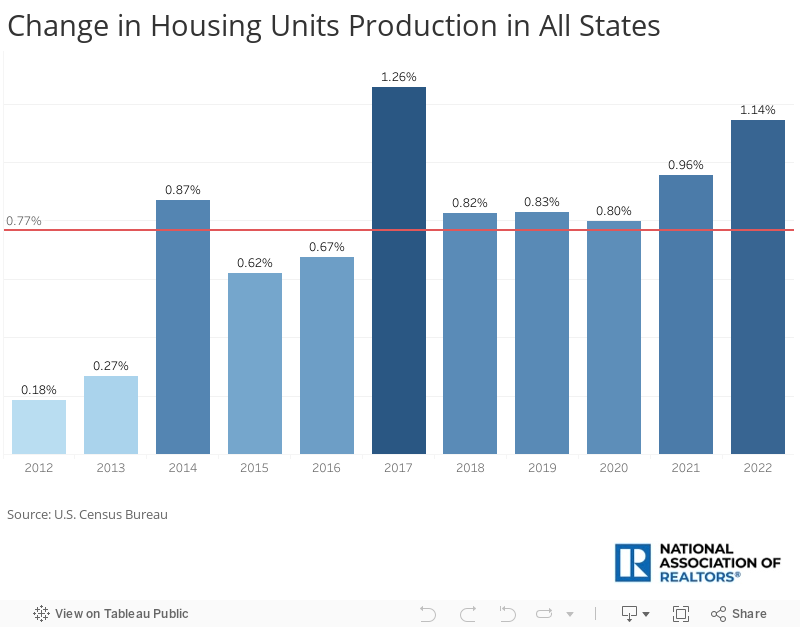
The total number of housing units increased from 264.9 million units in 2012 to 287.5 million units in 2022. The largest change was seen in 2017 when the number of units in the U.S. rose by 1.26% from the year before. The lowest change in the last 10 years was 0.18% between 2011 and 2012.
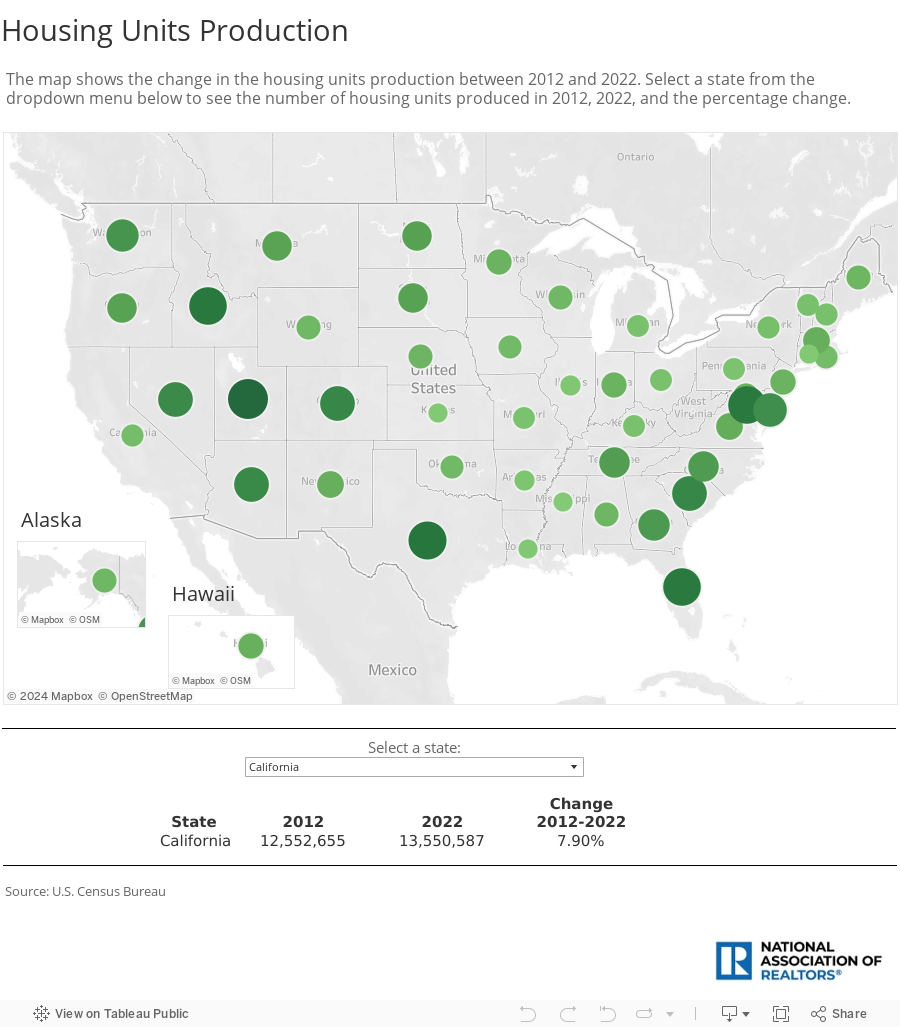
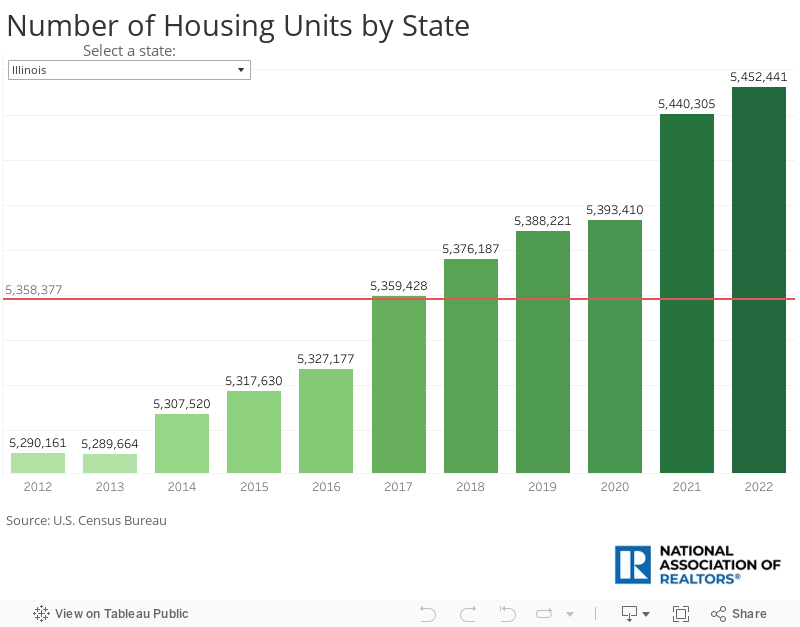
Texas (2,116,768), Florida (1,628,434), and California (997,932) had the largest number of housing units created between 2012 and 2022. Other large states that followed included North Carolina (567,970), Georgia (559,548), and New York (535,399). West Virginia (-5,215) was the only state with decreased unit production. Other states with low unit production included Vermont (18,570), Wyoming (19,804), and Alaska (22,954). To see how the number of housing units changed in each state over the years, select a state from the dropdown menu in the visualization below:
In terms of percentage change, Utah (26.1%), Texas (23.6%), and Idaho (23.0%) saw the largest change in the last 10 years, while Florida (22.6%) and Washington, D.C. (22.6%) followed in fourth and fifth place. The smallest change since 2012 was seen in West Virginia (-0.7%), followed by Mississippi (5.3%), Kansas (5.5%), and Connecticut (5.6%). Large states such as California and New York saw an increase of 7.9% and 7.4%, respectively, while New Jersey’s number of units increased by 9.9%. The housing units data also shows that states that issued fewer building permits had smaller unit growth throughout the decade.