

")


The dual phenomenon of record-high home prices and record-low inventory has significantly impacted home buyer choice. Even though inventory levels have been rising recently, these additional homes are mostly for higher-income buyers. Thus, there are still substantially fewer homes that especially middle-income households can afford to buy.
Moreover, mortgage rates have dramatically increased since the beginning of the year. Rates are about 2.5 percentage points higher since the first week of the year when rates were near 3.2%. As a result, buyers need to spend about $800 extra every month to be able to purchase a median-priced home. In the meantime, the outlook is for mortgage rates to rise even further, exceeding 6% as soon as next month. While mortgage rates have a direct impact on the monthly payment, a third “trouble” seems to be rising in the housing market. Home prices continue to increase, reaching new record highs. The cost for a median-priced home exceeded $400,000 for the first time in history. Inventory is improving but still near record lows. In addition, although mortgage rates are still historically low, they are significantly higher than a year earlier. Thus, the three main hurdles facing today’s housing market are record-high home prices, low inventory, and rising mortgage rates.
Let’s see how the affordability and availability of homes have changed since the beginning of the year due to these three factors.
Looking at the National Level
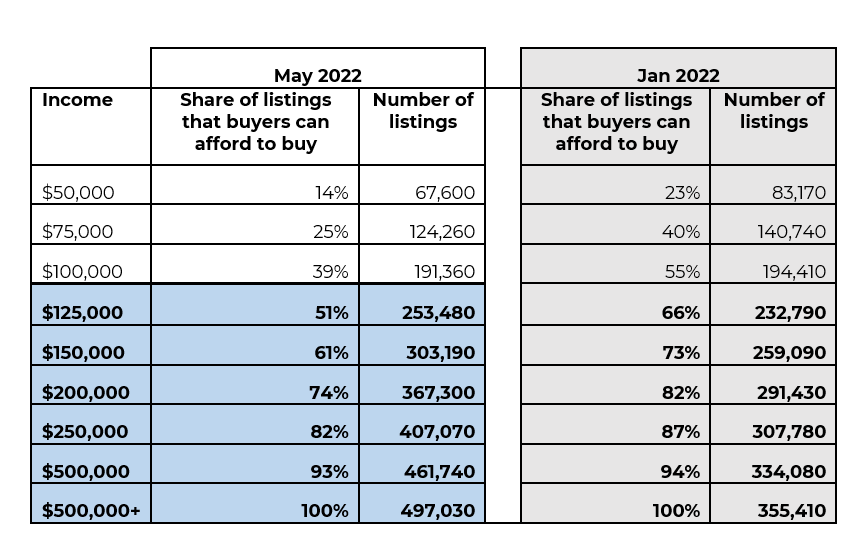
It’s very promising that housing inventory is improving. There are nearly 30% more homes available for sale compared to January. This translates to nearly 110,000 additional listings. Nevertheless, not all buyers can afford to buy these additional homes. Buyers need to earn at least $125,000 to afford to buy most of these additional homes.
For instance, there are about 124,260 homes that buyers earning $75,000 can currently afford to buy. However, in January there were 140,740 homes that these buyers were able to afford to buy. Thus, there are about 16,000 fewer listings now that these buyers can currently afford to buy compared to January.
In contrast, there are about 75,000 more homes available for sale for buyers earning $200,000. As of May 2022, these buyers can afford to purchase about 367,300 listings. This is an increase from 291,430 homes in January. For buyers with an income higher than $200,000, there are even more additional homes available for sale.
Thus, although affordability dropped for upper-income buyers, there are more homes available for sale for this income group because housing inventory has improved since the beginning of the year. In other words, the additional inventory offsets the drop in affordability for upper-income buyers.
Looking at the Local Level
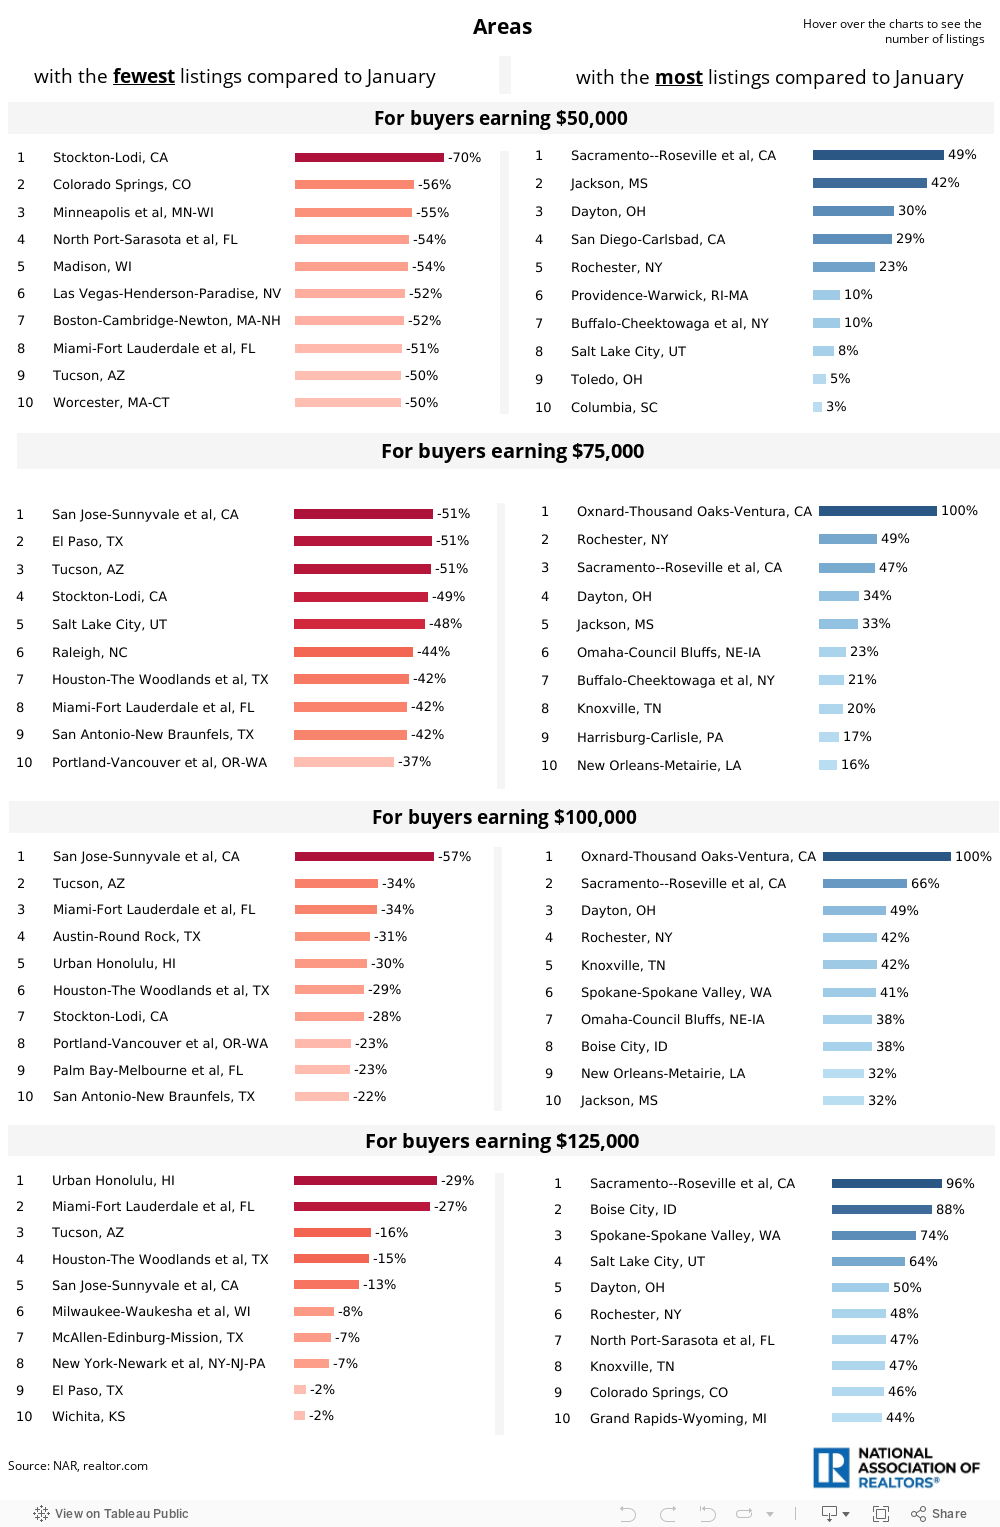
Since all real estate is local, the impact of rising mortgage rates is even larger in some areas. Even though inventory is improving in these areas, middle- and lower-income buyers can afford to buy fewer homes. For example, housing inventory has significantly improved in the Portland, OR metro area (an 83% increase) since January. However, there are about 40% fewer homes that buyers earning $75,000 can afford to buy now compared to January. In contrast, there are about 70% more listings that buyers earning $200,000 can afford to buy now compared to January in the Portland metro area.
Here is the list of the areas with the most and fewest listings now compared to January for buyers earning $50,000-$125,000:
All in all, it’s promising to see more homes available in the market, but more entry-level homes are needed.
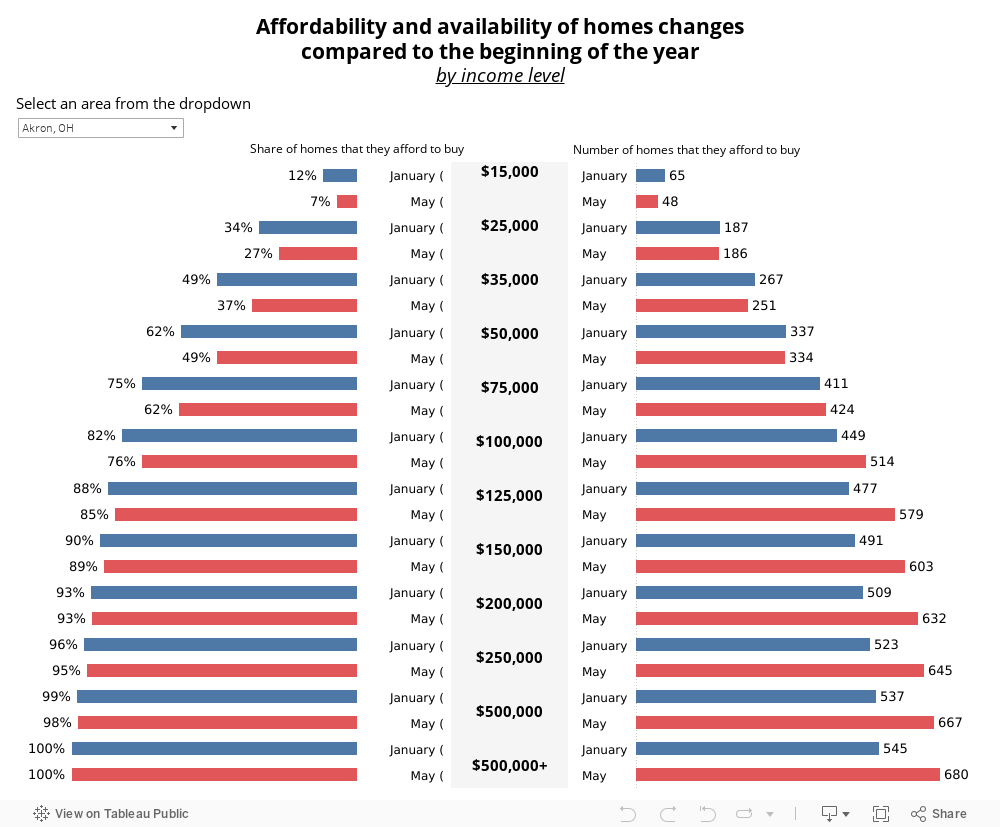
Select an area from the dropdown below to see how affordability and availability of homes changed compared to the beginning of the year for the 100 largest metro areas.