


Personal consumption spending accounts for nearly 70% of gross domestic product, so household spending is a key determinant of an economy’s expansion or contraction. The U.S. Census Bureau released its second-quarter GDP estimates and reported that personal consumption spending fell by nearly 35% on a seasonally adjusted annual rate.1 The recently released data captures spending in April through June, so this captures the period when states adopted sheltering-in-place measures that brought businesses to a halt.
But how is consumer spending trending in the third quarter? One such indicator is credit card/debit card transactions. Anonymized credit/debit card spending shows that credit/debit card spending is still down by 6% as of the week ending July 12 relative to January 4 – 31 (base period), 2020. However, this decline is much less compared to about 30% in the first week of April. The data also shows that credit/debit card spending declined more among high-income individuals (-10%) compared to low to middle income (-2% to -5%). Spending is still down in 40 states.
About 70% of Americans have credit cards, according to studies such as those done by the Atlanta Federal Reserve Bank.2 These trends are from Affinity Solutions, a platform that receives a daily feed of individual-level debit and credit card transactions and aggregates the data by type of spending categories and by income groups. Here’s what the data reveal about consumer spending as of the week ended July 12.3
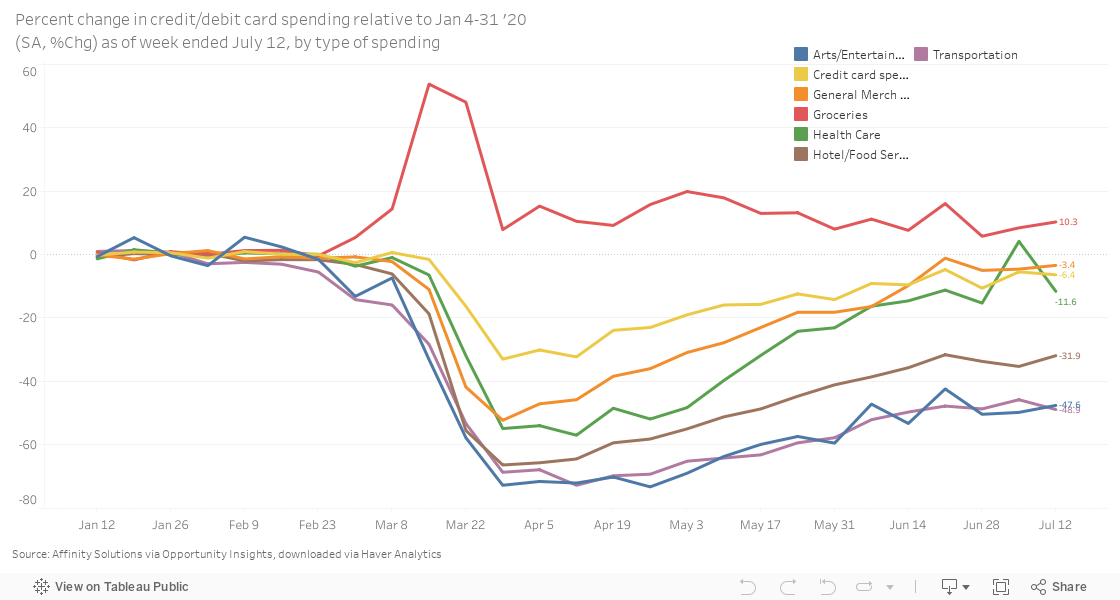
Credit/debit card spending by type of category: grocery spending is up 10% vs. base period
By type of spending, purchases on credit/debit cards have been robust, with spending up by about 10% compared to the base period. The largest credit/debit card purchase declines are in transportation and in arts, entertainment, and recreation, each of which is down by nearly 50%, though not as worse as the 70% decline in April. Spending on hotels and food services is still down by 32% compared to the reference period, but again, this is not as bad as the 60% decline in April. General merchandise stores spending is down more modestly by 3% while healthcare spending is down by 12%.
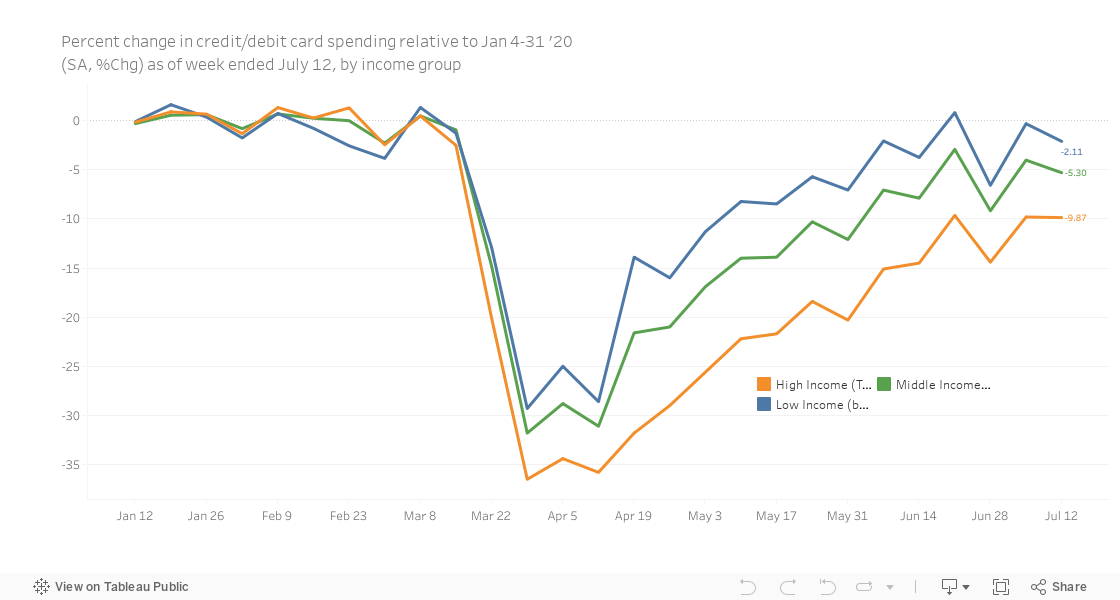
Credit/debit card spending by type of income group: high-income group shows a larger decline than low-mid income individuals
Credit/debit card spending reveals that the pullback is coming from individuals in the high-income (top income quartile). Credit/debit card spending fell to about 35% among the higher income credit/debit cardholders and is about 10% below the base period as of the week of July 12. Among the- low and middle-income individuals, spending declined by about 25% and is down by about 2% to 5% compared to the based period as of the week of July 12. One plausible explanation is that higher-income individuals are more likely to spend on ‘luxury goods’ such as travel (as seen in the large decline in transportation spending), dining out, and sports and theatrical events.
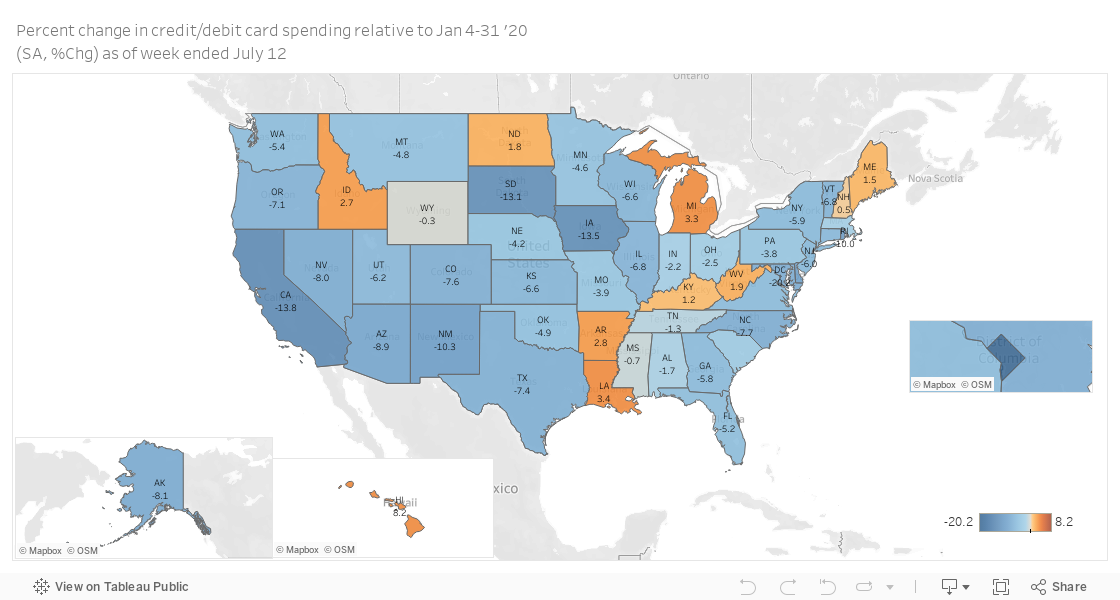
Credit/debit card spending is now higher than the pre-coronavirus period in 10 states
Credit/debit card spending is still down in most states by as much as 20% as of the week of July 12 compared to the base period. However, spending is up in 10 states: Idaho (+2.7%), North Dakota (+1.7%), Michigan (+3.3%), Maine (+1.5%), New Hampshire (+0.5%), West Virginia (+1.9%), Kentucky (+1.2%), Arkansas (+2.8%), Louisiana (+3.4%), and Hawaii (+8%).
Hover over the map below to view credit/debit card spending over time.
1 This means that consumption will have contracted by 35% over four quarters if the current pace of contraction continues.
3 Affinity Solutions. I downloaded the data from Haver Analytics