


Despite the economic downturn as a result of COVID-19, the industrial sector has been the commercial real estate darling as it continues to be one of the more resilient assets, supported by the growth in e-commerce and last-mile demand.
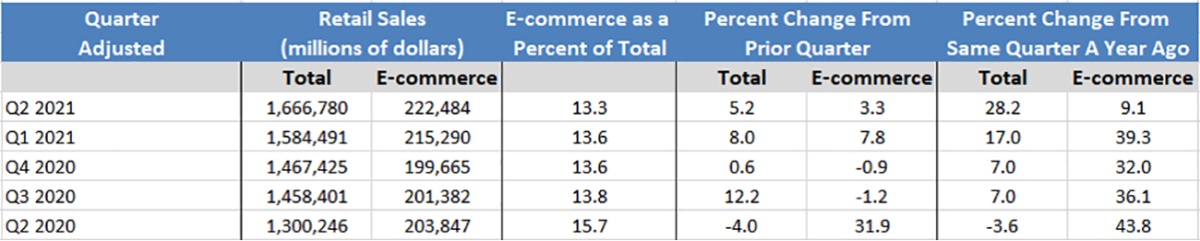
Year-over-year e-commerce growth recorded a 39.3% increase in Q1 2021 while Q2 2021 saw 9.1% year-over-year growth. The decrease in e-commerce sales from Q1 2021 to Q2 2021 is a result of supply chain disruptions and continued vaccine distribution, which allowed consumers to reallocate some of their spending from goods to pre-pandemic activities such as going out for dinner and traveling in spite of the Delta variant. The 9.1% growth for Q2 2021 current e-commerce dollars exceeds the historic $203.8 billion recorded Q2 2020. However, the significant increases in demand put pressure on retailers, logistics, and wholesalers to provide goods to consumers in a compressed period of time whilst containing transportation and other overhead costs.
E-commerce remains the primary motivator for the increased demand for quality industrial space. As of the second quarter of 2021, the demand for industrial space remains robust as vacancy rates continue to decrease and as rent growth continues an upward trajectory across the United States. Accordingly, developer and investor interest in the acquisition of industrial assets persist as they pursue opportunities to capitalize from current market dynamics. The continued demand for industrial space for e-commerce fulfillment, warehousing, manufacturing tenants, and other uses as firms alter their supply chains suggests that developers may have difficulty matching supply with demand over the short term. This in turn will keep vacancy rates low (5.1% as of Q2 2021), while stimulating solid rent growth. Correspondingly, U.S. cap rates for industrial properties have been decreasing whereas cap rates from Q3 2020, Q4 2020, and Q1 2021 were at 7.2%, 6.8%, and 6.6% respectively, until the modest uptick to 6.7% in Q2 2021. While an increase from the previous quarter, cap rates over the same period last year were 7.1%.

This increase in Q2 2021's cap rate over Q1 2021 is still lower than pre-pandemic levels and amounts to a year-over-year decrease of 34 basis points. Logistics, specialized, and flex industrial spaces all saw increases in cap rates from Q1 2021. Both logistics space and specialized industrial space saw price recovery with respect to the same period a year ago, while flex space remained unchanged.
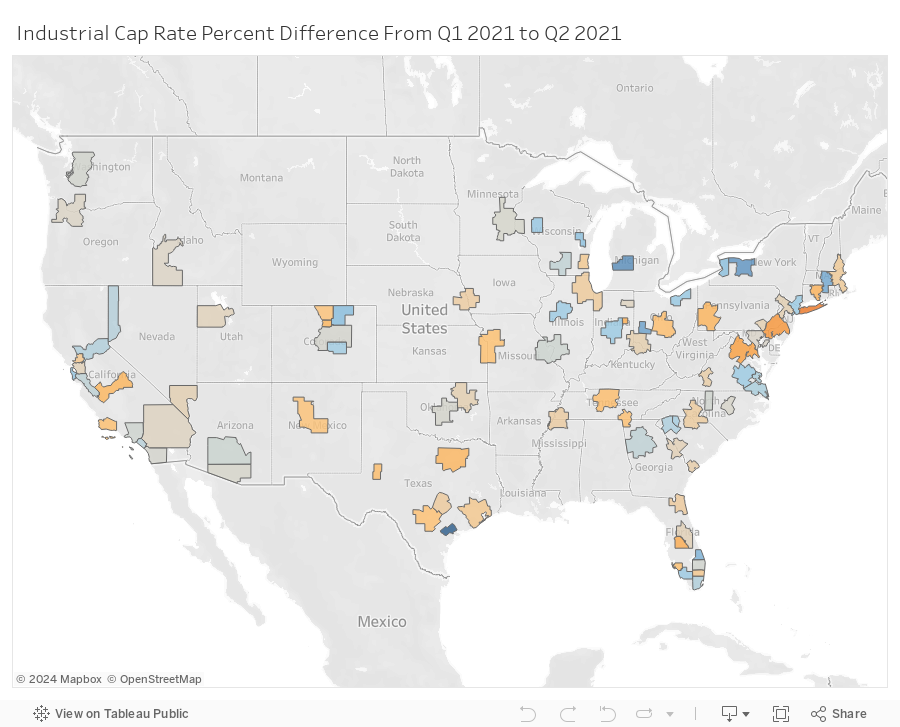
According to NAR's analysis of CoStar® data, of the metros with reported cap rates for Q1 2021 and Q2 2021, 39 metros experienced decreases in cap rates. While cap rates increased in 47 covered metros, the increase likely shows the limited amount of supply traded.
The maps below show the cap rates where there was an increase (red) and where there was a decrease with respect to the previous quarter (blue). The metro areas with the largest positive percent difference in cap rates as of Q2 2021 are Long Island, New York (6.3%); Philadelphia, Pennsylvania (4.3%); Washington, DC (3.7%); Lakeland, Florida (2.8%); Muncie, Indiana (2.7%); and Hartford, Connecticut (2.3%). The metros that saw the largest decline in cap rates, that is, where industrial asset prices are recovering strongly were Victoria, Texas (-14%); Grand Rapids, Michigan (-8.3%); and Rochester, NY (-7.3%)
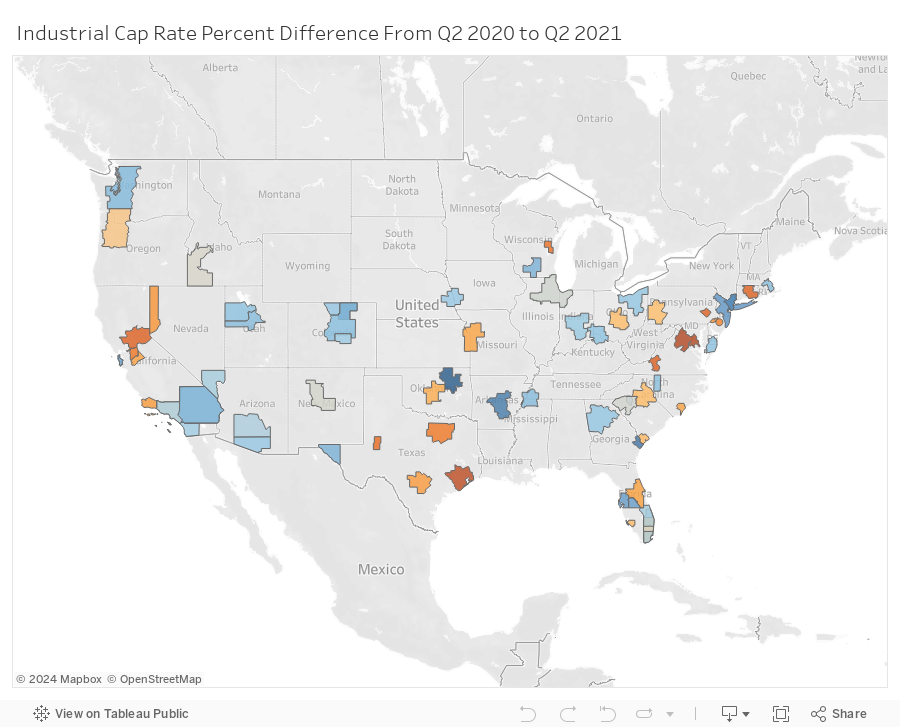
Q2 2021 industrial cap rates decreased in 41 covered metros year-over-year while increasing in 28 metros. The map below illustrates the percent difference between Q2 2020 and Q2 2021 for the metros covered. The metros with the largest positive difference in cap rates from Q2 2020 to Q2 2021 were Washington, DC (4.3%); Houston, Texas (4.3%); Roanoke, Virginia (3.0%); Sacramento, California (3.0%); Reading, Pennsylvania (2.9%); and Hartford, Connecticut (2.9%). Industrial prices made some recovery with respect to the same period a year ago in Tulsa, Oklahoma (-4.9%); Greeley, Colorado (-3.9%); Savannah, Georgia (-3.7%); Little Rock, Arkansas (-3.5%); and Long Island, New York (-3.0%).
Industrial prices continue to increase across the majority of metros covered, with rental growth being a key driver. As a result of the continuing tight market conditions and strong industrial demand, another quarter of rent growth was recorded in Q2 2021, increasing at a 5.5% rate over 12 months. Rents for the U.S. industrial market also hit $9.26 a square foot, another record high rental rate.
Nevertheless, there are no indicators that the industrial market will decelerate when there are rents reaching new heights, increased development, continued decreasing vacancy rates, and continued positive net absorption. Despite the slight uptick in cap rates, the demand for industrial space will continue to be strong as e-commerce dollars continue to increase. As a result, cap rates are not expected to move substantially in the near-term.