


Since the beginning of the pandemic, we have seen a lot of changes in home buyers’ preferences and demand for real estate, driven by events such as the COVID-19 pandemic, rising mortgage rates, and government shutdowns. Using data from the Home Mortgage Disclosure Act and NAR Historic Membership Count, we can evaluate past and current home buyers’ demand for housing in each state. Overall, the number of mortgage loan applications has been steadily increasing since 2010, but recent events caused a sharp decline in the numbers from 2021, even though the count of NAR members are on the rise.
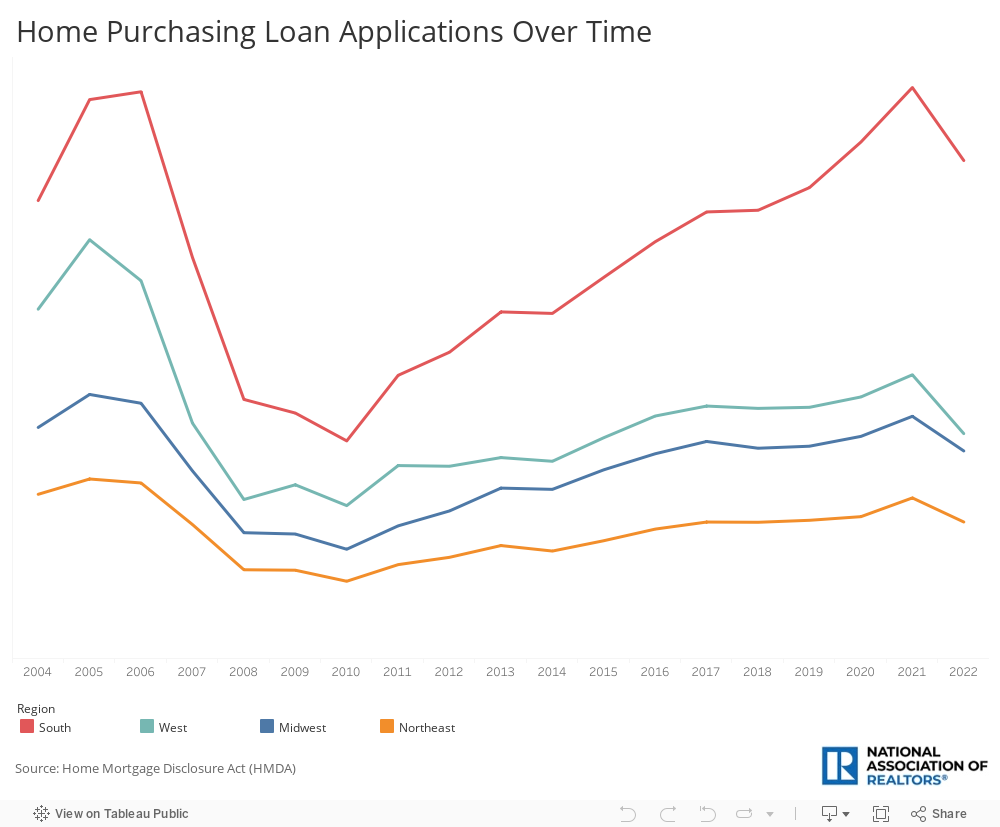
Loan Applications Growth by Region
Between 2004 and 2022, the South region saw the highest growth in the number of applications for home purchasing loans, topping with 4,069,126 applicants in 2021. In contrast, the Northeast region saw the smallest growth in applications, with the highest number being 1,144,420 in 2021. Since the aftermath of the Great Recession, home purchasing loan applications have been steadily increasing in all states, reaching a maximum during the pandemic. In March of 2022, the Federal Reserve initiated a contractionary monetary policy to ease up inflation, subsequently causing the mortgage rates to rise and lowering the number of people applying to purchase a home.
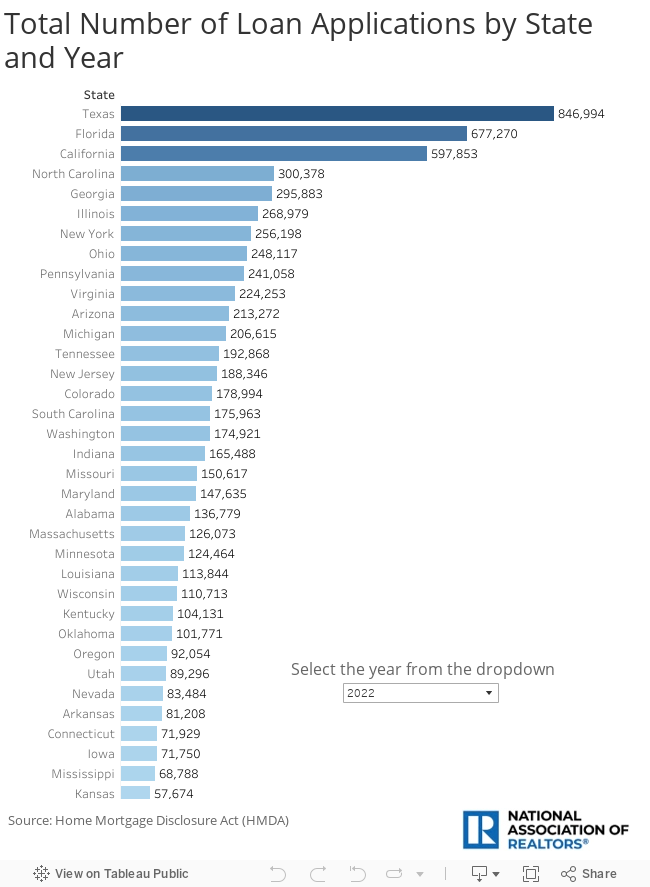
Loan Applications Growth by State
California is leading in the number of loan applications for home purchasing, with a total of 13,434,271 applications between 2004 and 2022. Following behind are Texas and Florida, with 12,817,888 and 10,389,071 total applications respectively. However, California wasn’t always at the top of the chart. In 2013, Texas surpassed the Golden State, exceeding it by 6,346 applications and keeping this trend all the way through last year. Consistently, Texas was leading in the number of home purchasing applications before and after the pandemic, with over 700,000 applications in 2019 and almost 850,000 applications in 2022. Historically, Vermont, North Dakota, Wyoming, and Washington D.C. had the smallest number of applications, with less than 300,000 total applications over the years.
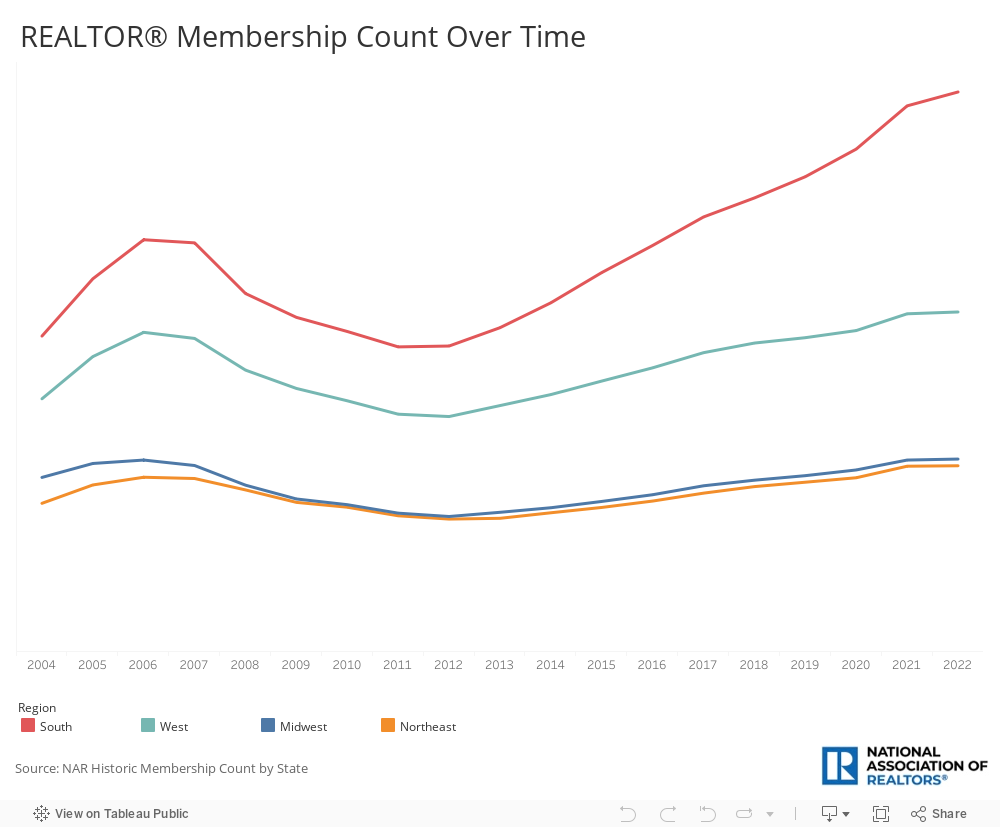
NAR Membership Count by Region
Similar to the trend of loan applications, the number of REALTOR® members has been on the rise between 2012 and 2021. Despite the falling home sales in 2021, all regions showed an increase in the number of members, and the membership count is still on the rise. This implies that even though home buyers are reevaluating their plans, REALTORS® are still in high demand. As with mortgages, the Southern and the Western states saw the largest growth in membership over the years, while the Northeast and the Midwest regions followed behind.
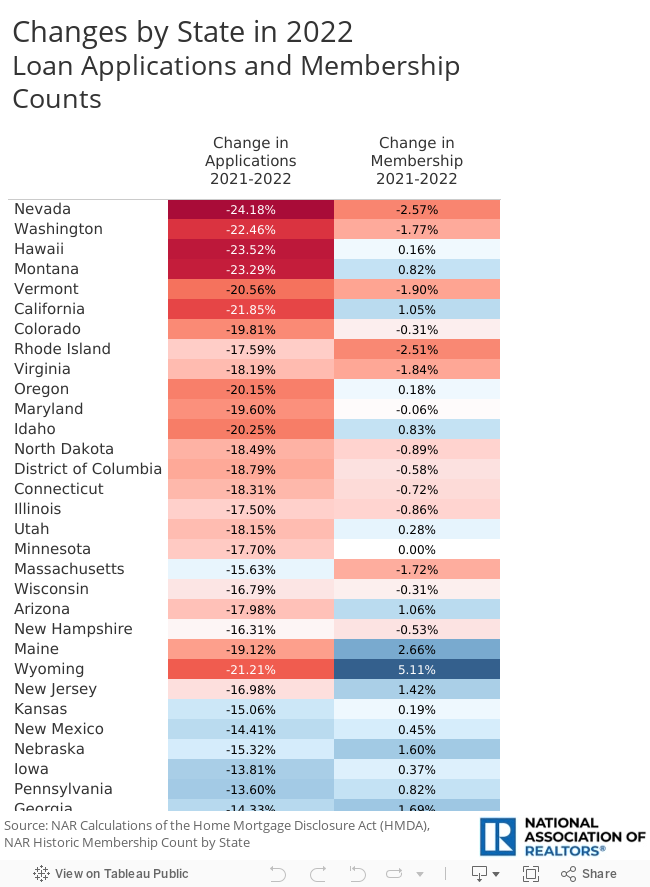
What Has Changed in the Last Year
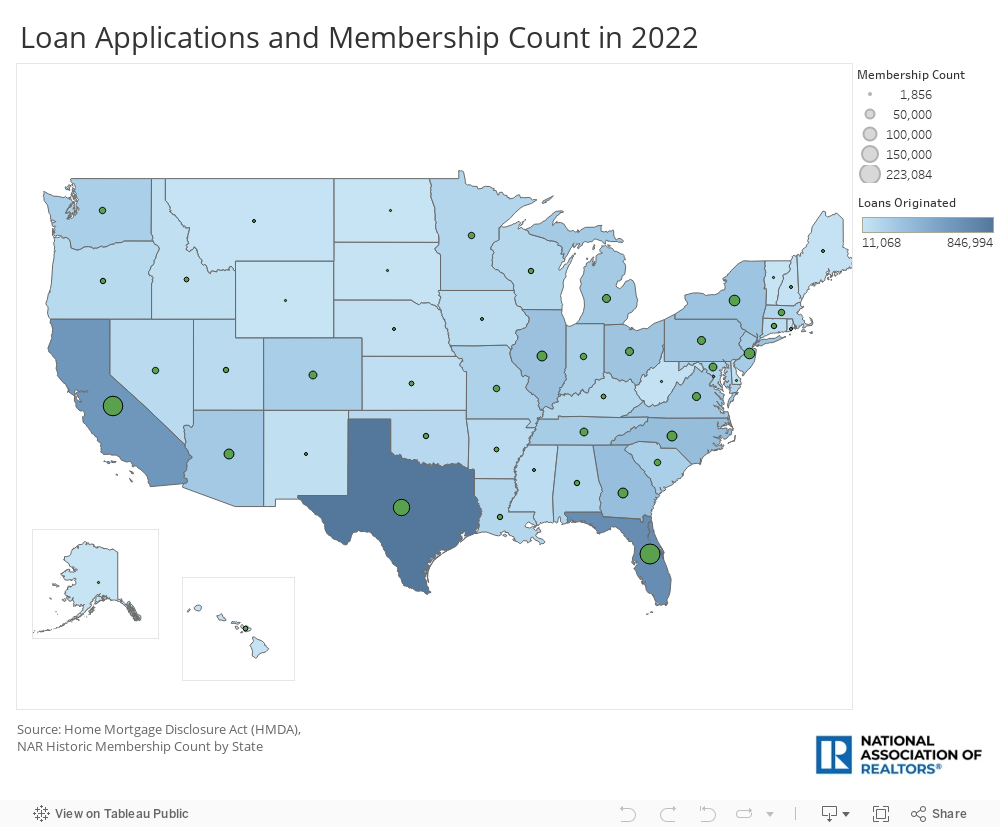
The change in housing demand is more prominent in some states than in others. For example, Nevada saw a significant loss in loan applications (-24.18%) even though its share of NAR membership stayed nearly the same (-2.57%). California also saw a large decline in the number of applications (-21.58%), however, its membership count increased (1.05%). Other Western states like Hawaii, Montana, Washington, and Wyoming showed a similar significant decrease in the number of people applying to purchase a home alongside an increase or no significant change in the number of REALTORS®. In contrast, Southern states like Mississippi, West Virginia, and Texas saw the smallest change in applications from last year (less than 8% decrease) but gained more members over that year (between 1.94% and 5.06%). This interesting observation could be due to lags between the mortgage applications and the membership count- REALTORS® may take a year or two to respond to changes in the demand for housing.
See below for the number of loan applications (home purchase only) and the membership count in each state. Hover over each state to see the data.