

")


A 2024 Gallup study indicates that the proportion of U.S. adults who identify as lesbian, gay, bisexual, transgender or gender nonbinary (LGBTQ+) has almost tripled, from 3.5% in 2012 to 9.3% in 2024—representing over 31 million U.S. adults. This increase is driven mainly by younger generations: The proportion of Millennials (born between 1980 and 1996) who identify as LGBTQ+ rose from 5.8% in 2012 to 14% in 2024. The proportion of Generation Z (born between 1997 and 2012) is even higher, as 23% now identify as LGBTQ+, up from 15% just three years prior in 2021.
NAR gathers data on homebuyers and sellers to provide trends and market intelligence about the latest developments in the residential market. The results are tabulated in the popular annual Profile of Home Buyer and Home Sellers (HBS). In addition, the data is extracted to create reports on various demographic snapshot reports and blogs, such as this one.
NAR first added a question about sexual orientation to its HBS study in 2015 and added questions regarding gender and gender identity in 2019. NAR last examined the LGBTQ+ population among home buyers and sellers in 2021 with data aggregated from 2015 to 2020. The total percentage in this HBS data that identified as LGBTQ+ rose from 4% in 2021 to just over 5% in 2024. And while transgender and gender nonbinary individuals made up less than 1% of buyers and sellers overall in 2024, they increased from 8% to 11% of LGBTQ+ buyers and sellers over four years. Given that Millennials and Generation Z make up 32% of home buyers and one in five home sellers and given further shifting attitudes regarding orientation and identity among Generation Z in particular, the proportion of buyers and sellers identifying as LGBTQ+ is likely to continue to increase.
This blog examines data aggregated from 2021 to 2024 HBS data. Differences were examined by LGBTQ+, non-LGBTQ+, lesbian, gay, bisexual, and trans/nonbinary buyers and sellers, and results were compared to data aggregated in 2021 for 2015 to 2020. As in 2021, there are distinct differences between LGBTQ+ and non-LGBTQ+ home buyers and sellers, as well as differences among the various categories of LGBTQ+ identification. LGBTQ+ buyers and sellers tend to have different household characteristics, face different obstacles as buyers, and are more likely to have made more and different sacrifices than non-LGBTQ+ buyers to achieve homeownership in a market that is challenging for all buyers.
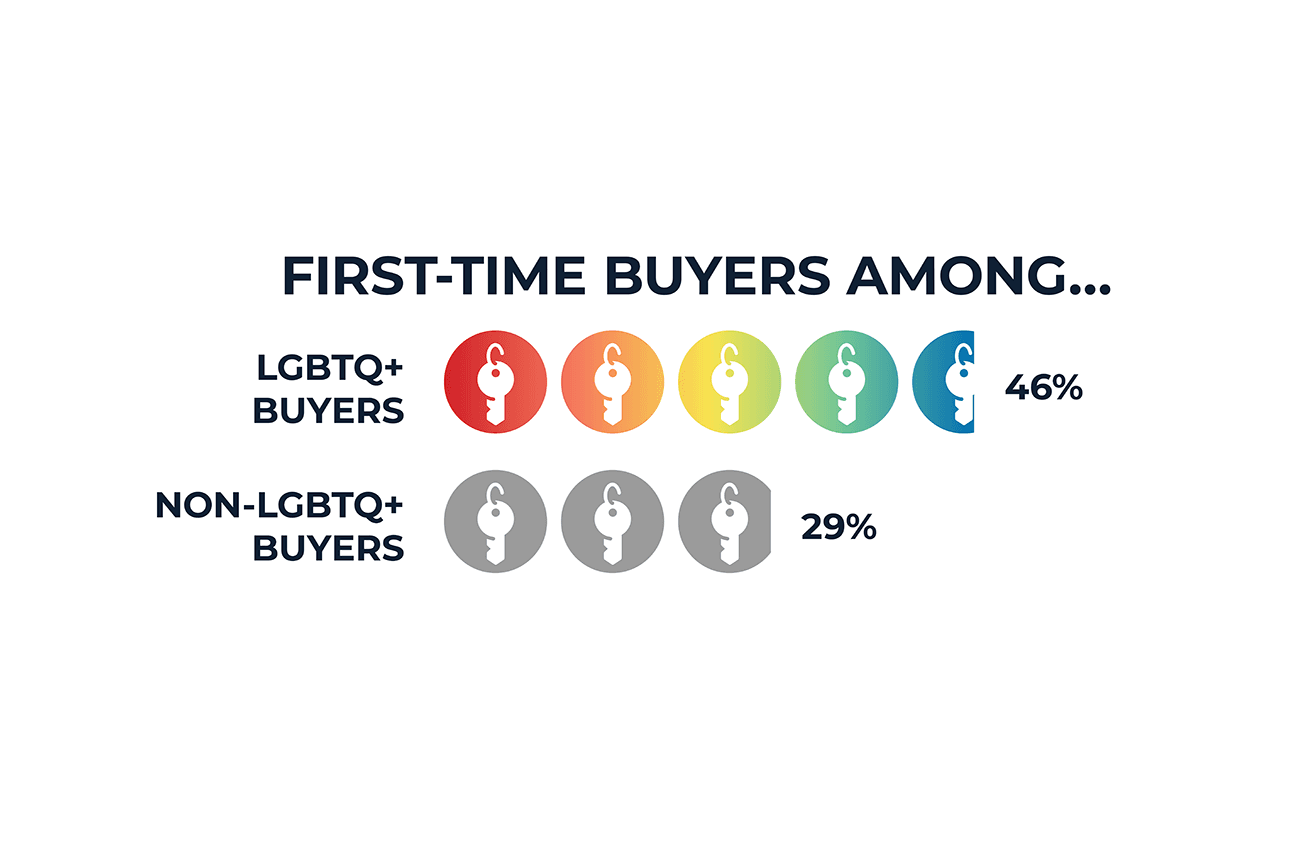
LGBTQ+ buyers and sellers are significantly more likely to be first-time buyers than non-LGBTQ+: 46% vs. 29%. This is both up from 2021 and a wider gap between these buyer types than four years ago, when the difference was 42% vs. 32%. For most LGBTQ+, this is related to age: LGBTQ+ buyers are younger than non-LGBTQ+ buyers overall and in all categories. However, as in 2021, bisexuals are more likely to be first-time buyers regardless of age.
LGBTQ+ sellers are also more likely than others to be first-time sellers (40% vs. 28%), again a wider gap than 37% vs. 33% in 2021. This is a factor of younger age for most LGBTQ+ sellers. However, lesbian and trans/nonbinary sellers over age 55 are still more likely than other sellers in their age groups to be first-timer sellers – 26% vs. 15% among 55+ lesbian and 38% vs. 15% among trans/nonbinary 55+ sellers.
Income and Household Characteristics
As in 2021, LGBTQ+ buyers and sellers earn slightly less than non-LGBTQ+; most of these differences can be accounted for by age. However, even when age is factored in, bisexuals earn significantly less than any other category. Two-thirds (67%) of bisexuals, however, identify as female, and differences in income disappear when controlled for gender. So, this lower income is related to gender rather than to sexual orientation.

Household composition also plays a role in what LGBTQ+ buyers and sellers can afford. LGBTQ+ buyers and sellers are less likely than non-LGBTQ+ to be married couples, who reap greater tax benefits. Meanwhile, lesbians and bisexuals are significantly more likely than others to be single females, with gay men significantly more likely to be single males, earning more on average than their female counterparts. Bisexual and trans/nonbinary buyers and sellers are least likely of all categories to be married couples, with trans/nonbinary individuals significantly more likely than others to describe another household composition not listed.

LGBTQ+ buyers and sellers are now more likely to have children in their households than in 2021 (20% vs. 17%). Bisexuals are as likely as non-LGBTQ+ buyers and sellers to be parents (30%) and are more likely than others to be single mothers (8% vs. 3%), adding greater financial pressure on this group.
LGBTQ+ buyers and sellers are also more likely than others to live in one-person households (25% vs. 18%) and households with one income earner (42% vs. 39%). Interestingly, trans/nonbinary buyers and sellers are more likely to cite three or more income earners (13% vs. 9%), but are no more or less likely than others to be in multigenerational households. This, along with the increased incidence of other household compositions, suggests that trans/nonbinary buyers may be more likely to pool resources with multiple people of similar ages to achieve the American dream.
Difficulties With Home Buying
LGBTQ+ buyers are more likely than non-LGBTQ+ buyers to have made at least one sacrifice to purchase their homes (45% vs. 39%). Bisexual and trans/nonbinary buyers are the most likely to have done so; over half of each cite at least one sacrifice made.

LGBTQ+ buyers are also more likely than non-LGBTQ+ buyers to cite at least one difficult step in the buying process (89% vs. 82%), with "understanding the process and steps" (22% vs. 15%) and saving for a down payment (21% vs. 13%) topping the list. Among those citing saving for a down payment as a difficult step, LGBTQ+ buyers are more likely than non-LGBTQ+ to have been held back by both high rent/current mortgage payments (36% vs. 25%) and student loan debt (38% vs. 24%).
Over one in three LGBTQ+ buyers (35%) report having student loans vs. one in five non-LGBTQ+ buyers (20%). These student loan holders have higher student loan debt than their non-LGBTQ+ counterparts: a median of $35,000 vs. $30,000. Bisexuals are the most likely to hold student loan debt (45%), with lesbians and gay men reporting the highest median amounts.

LGBTQ+ buyers and sellers face different obstacles in the homebuying and selling processes than other home buyers and sellers. Bisexual and trans/nonbinary buyers and sellers in particular face more and different challenges than their lesbian and gay counterparts and may have different needs. While some of these factors are related to younger overall ages among LGBTQ+ buyers and sellers, others are intrinsic to the ways in which they walk through the world. Sensitivity to these issues will help real estate professionals better serve their LGBTQ+ clients in helping them achieve and continue homeownership in a challenging market.
Here are a few suggestions on how REALTORS® can use this:
- Develop tailored marketing and outreach strategies that address the unique needs and challenges of the growing population of LGBTQ+ first-time buyers and sellers. Understanding where demand is increasing helps real estate professionals connect with the right buyers and sellers.
- Include LGBTQ+ buyers in first-time buyer programs' focus: Provide financial-planning support and resources, such as down payment assistance and educational workshops, to help LGBTQ+ clients navigate the homebuying process.
- Promote inclusivity and sensitivity in branding and client interactions, ensuring LGBTQ+ clients feel welcomed and respected throughout their real estate journey.
NAR gathers data on homebuyers and sellers to provide trends and market intelligence about the latest developments in the residential market. The results are tabulated in the popular annual Profile of Home Buyer and Home Sellers (HBS). In addition, the data is extracted to create reports on various demographic snapshot reports and blogs, such as this one.
Advertisement