


")


WASHINGTON (August 12, 2025) – Seventy-five percent of metro markets (170 out of 228) registered home price gains in the second quarter of 2025, according to the National Association of REALTORS®' Metropolitan Median Area Prices and Affordability and Housing Affordability Index. This is down from 83% in the first quarter. Five percent of metro areas recorded double-digit price gains in the second quarter, down from 11% in the first quarter of 2025.
The national median single-family existing-home price grew 1.7% year-over-year to $429,400 – a record high. In the first quarter, the national median price increased 3.4% year-over-year.
Median existing single-family home price by region (year-over-year change)
- Northeast: $527,200 (+6.1%)
- Midwest: $328,800 (+3.5%)
- West: $646,100 (+0.6%)
- South: $376,300 (No change)
"Home prices have been rising faster in the Midwest, due to affordability, and the Northeast, due to limited inventory," said NAR Chief Economist Lawrence Yun. "The South region – especially Florida and Texas – is experiencing a price correction due to the increase in new home construction in recent years."
"Home sales and the homeownership rate are underperforming relative to job growth," added Yun. "There have been over 7 million net job additions compared to the pre-COVID peak. However, elevated mortgage rates have kept home sales below pre-COVID levels. The homeownership rate has fallen by a full percentage point since early 2023."
"If interest rates decline, the strongest release of pent-up housing demand is likely to occur in states with significant job growth in recent years, such as Idaho, Utah, the Carolinas, Florida, and Texas."
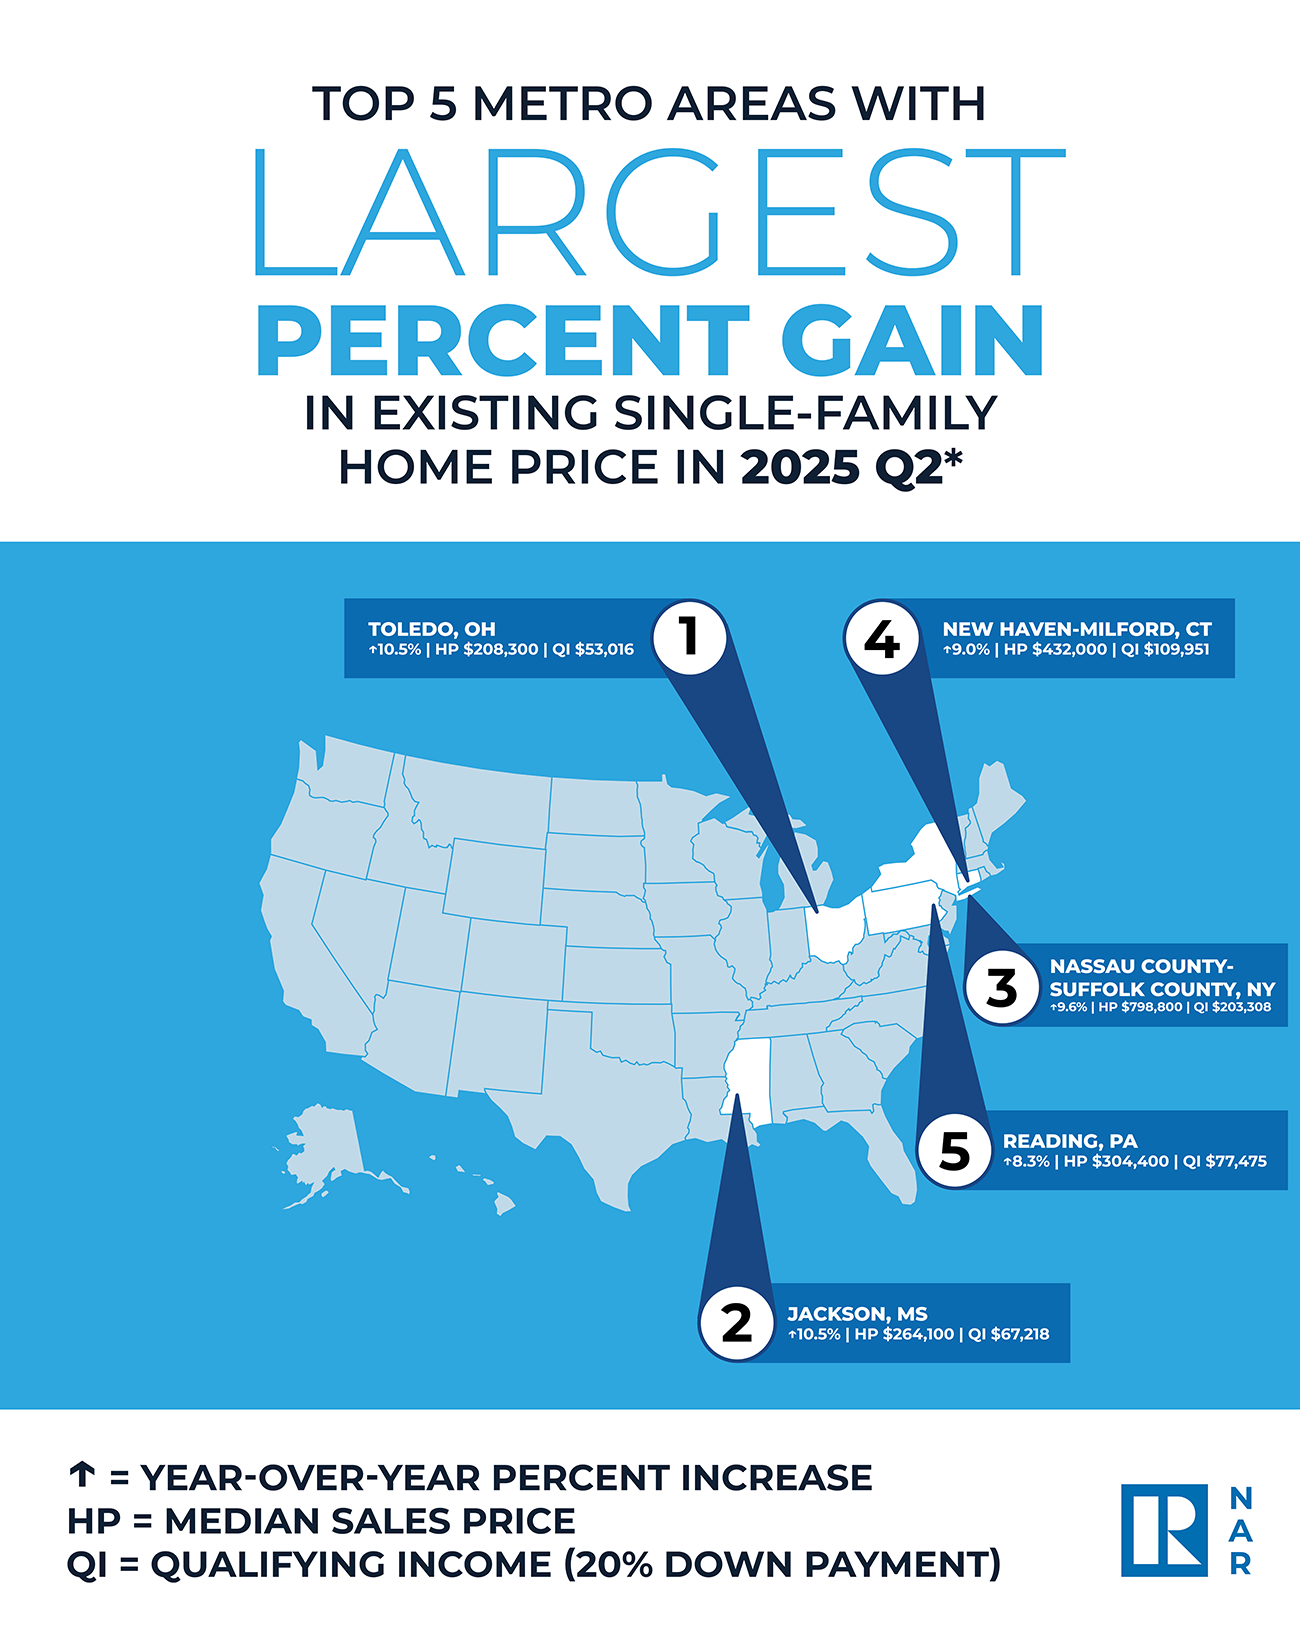
10 large markets with biggest year-over-year median price increases
- Toledo, Ohio (10.5%)
- Jackson, Miss. (10.5%)
- Nassau County-Suffolk County, N.Y. (9.6%)
- New Haven-Milford, Conn. (9.0%)
- Reading, Pa. (8.3%)
- Springfield, Mo. (8.2%)
- Akron, Ohio (8.1%)
- Montgomery, Ala. (7.9%)
- Cleveland-Elyria, Ohio (7.8%)
- Rochester, N.Y. (7.8%)
10 Most expensive markets
- San Jose-Sunnyvale-Santa Clara, Calif. ($2,138,000; 6.5%)
- Anaheim-Santa Ana-Irvine, Calif. ($1,431,500; -0.4%)
- San Francisco-Oakland-Hayward, Calif. ($1,426,000; -1.6%)
- Urban Honolulu, Hawaii ($1,148,600; 4.3%)
- San Diego-Carlsbad, Calif. ($1,025,000; -2.4%)
- Salinas-Monterey, Calif. ($978,400; -5.5%)
- Oxnard-Thousand Oaks-Ventura, Calif. ($958,100; 3.3%)
- San Luis Obispo-Paso Robles, Calif. ($928,000; 3.7%)
- Los Angeles-Long Beach-Glendale, Calif. ($879,900; 2.9%)
- Boulder, Colo. ($859,500; -3.2%).
Housing affordability
- 24% of markets experienced declining home price
- Up from 17% last quarter
- $2,256: monthly mortgage payment on a typical existing single-family home with a 20% down payment
- 6.5% increase quarter-over-quarter
- 0.3% decrease year-over-year
- 25.7%: average share of income typical families spent on mortgage payments
- Up from 24.4% last quarter
- Down from 26.9% last year
First-time buyers
- $2,212: the monthly mortgage payment for a typical starter home valued at $365,000 with a 10% down payment
- $134 increase from Q1
- $6 decline year-over-year
- 38.7%: share of income first-time buyers spent on monthly mortgage payments
- Up from 36.8% in Q1
- Down from 40.6% year-over-year
About the National Association of REALTORS®
The National Association of REALTORS® is involved in all aspects of residential and commercial real estate. The term REALTOR® is a registered collective membership mark that identifies a real estate professional who is a member of the National Association of REALTORS® and subscribes to its strict Code of Ethics. For free consumer guides about navigating the homebuying and selling transaction processes – from written buyer agreements to negotiating compensation – visit facts.realtor.
# # #
Data tables for MSA home prices (single-family and condo) are posted at https://www.nar.realtor/research-and-statistics/housing-statistics/metropolitan-median-area-prices-and-affordability. If insufficient data is reported for an MSA in a particular quarter, it is listed as N/A. For areas not covered in the tables, please contact the local association of REALTORS®.
NOTE: NAR releases quarterly median single-family price data for approximately 230 Metropolitan Statistical Areas (MSAs). In some cases, the MSA prices may not coincide with data released by state and local REALTOR® associations. Any discrepancy may be due to differences in geographic coverage, product mix, and timing. In the event of discrepancies, REALTORS® are advised that for business purposes, local data from their association may be more relevant.
Areas are generally metropolitan statistical areas as defined by the U.S. Office of Management and Budget. NAR adheres to the OMB definitions, although in some areas an exact match is not possible from the available data. A list of counties included in MSA definitions is available at: https://www.census.gov/geographies/reference-files/time-series/demo/metro-micro/delineation-files.html.
Regional median home prices are from a separate sampling that includes rural areas and portions of some smaller metros that are not included in this report; the regional percentage changes do not necessarily parallel changes in the larger metro areas. The only valid comparisons for median prices are with the same period a year earlier due to seasonality in buying patterns. Quarter-to-quarter comparisons do not compensate for seasonal changes, especially for the timing of family buying patterns.
Median price measurement reflects the types of homes that are selling during the quarter and can be skewed at times by changes in the sales mix. For example, changes in the level of distressed sales, which are heavily discounted, can vary notably in given markets and may affect percentage comparisons. Annual price measures generally smooth out any quarterly swings.
NAR began tracking of metropolitan area median single-family home prices in 1979; the metro area condo price series dates back to 1989.
The seasonally adjusted annual rate for a particular quarter represents what the total number of actual sales for a year would be if the relative sales pace for that quarter was maintained for four consecutive quarters. Total home sales include single-family, townhomes, condominiums and co-operative housing.
