")


Homeowners are the clear winners in the housing market, continuing to experience strong appreciation as home prices remain on a steady upward march nationwide. Some markets are still seeing double-digit gains. Syracuse, N.Y., has seen the largest home price increase in the country over the past year—up about 18% annually, according to the National Association of REALTORS®’ latest quarterly report, based on first quarter metro sales data.
“Most metro markets continue to set new record highs for home prices,” says NAR Chief Economist Lawrence Yun, noting that more than 80% of metro areas saw home price increases in the first quarter.
Compared to one year ago, the national median price for existing single-family homes rose 3.4% to $402,300, NAR reports. In the previous quarter, the year-over-year increase had been nearly 5%, indicating that while prices are still climbing, the pace of growth has slowed somewhat.
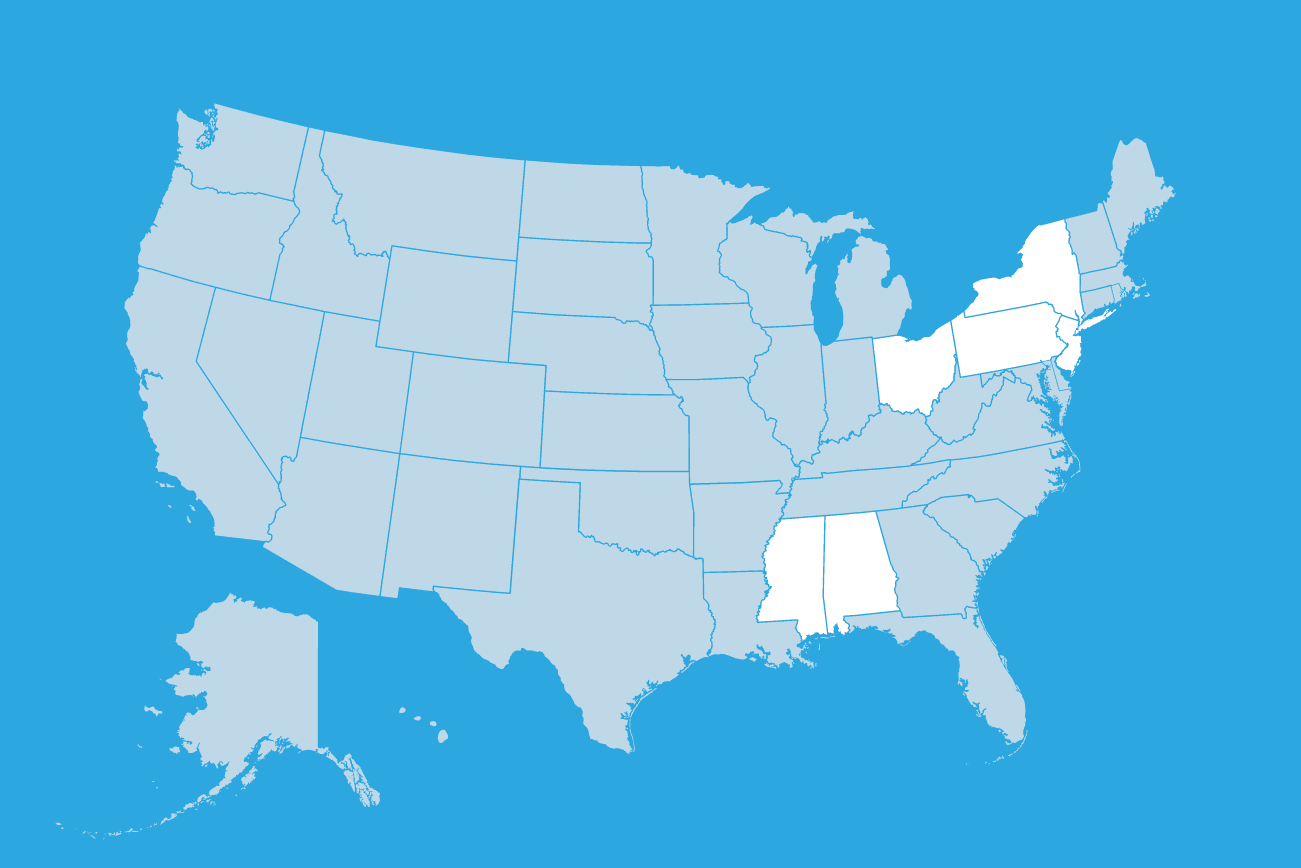
10 Metros Posting Highest Annual Price Gains
The Northeast is seeing some of the highest home price increases over the past year, with prices up 10.3% annually, according to NAR’s report. That’s followed by a 5.2% year-over-year gain in the Midwest and a 4.1% increase in the West. While the South accounted for the largest share of existing-home sales in the first quarter, it posted the slowest annual price appreciation, rising just 1.3% by comparison.
NAR’s report highlights the following 10 metro areas as having the largest year-over-year percentage increases in the first quarter among the nation’s 150 largest markets.
| Markets | Growth | Median Price |
|---|---|---|
| Syracuse, N.Y. | 17.9% | $234,300 |
| Montgomery, Ala. | 16.1% | $230,000 |
| Youngstown-Warren-Boardman, Ohio-Pa. | 13.6% | $161,900 |
| Nassau County-Suffolk County, N.Y. | 12.0% | $779,300 |
| Toledo, Ohio | 11.1% | $183,900 |
| Cleveland-Elyria, Ohio | 11.1% | $213,200 |
| Rochester, N.Y. | 11.1% | $235,900 |
| Gulfport-Biloxi-Pascagoula, Miss. | 10.5% | $232,900 |
| Trenton, N.J. | 10.4% | $420,100 |
| Allentown-Bethlehem-Easton, Pa.-N.J. | 10.2% | $355,600 |
Small Share of Metros Post Home Price Declines
Nearly 17% of the 228 markets tracked—or 38—saw home prices decline in the first quarter. That’s up from 11% in the fourth quarter of 2024, according to NAR’s latest housing report. But Yun notes there isn’t reason for alarm.
“A few areas where home prices declined a year or two ago are now rebounding, including Boise, Las Vegas, Salt Lake City, San Francisco and Seattle,” Yun says. “Similarly, some markets experiencing price declines but with solid job growth could see prices recover in the near future.” Austin, San Antonio, Huntsville, Myrtle Beach, Raleigh and many Florida markets are areas that could rebound fairly quickly, he says.
Yun points to growing housing inventory—often in Southern markets from an uptick in new-home construction—as the reason some areas have seen prices come down somewhat. “But let’s remember, prices have risen so much over recent years,” he says. “[Homeowners] are not selling in a distressed situation but still selling with a profit. … And with so much new job creation and people from other states moving into places like Florida and Texas, I think it’s going to be a short-phase decline before picking up again.” Yun notes that distress in the market—foreclosures, short sales and mortgage defaults—continue to be at historically low levels.
“It’s still a very good time to be a homeowner,” Yun says. “About 88 million homeowners across the country are consistently smiling because they’re seeing a large home price gains. This is a sizable wealth gain at a time when the stock market has undergone some volatility.”
10 Priciest Markets in the U.S.
Not surprisingly, eight of the 10 priciest markets in the U.S. are in California, proving the Golden State remains a hot spot. And many of these markets continue to see home price gains.
“Very expensive home prices partly reflect multiple years of home underproduction in those metro markets,” Yun says. “Another factor is the low homeownership rates in these areas, implying more unequal wealth distribution. Affordable markets tend to have more adequate supply and higher homeownership rates.”
NAR’s latest report revealed the following markets registered the highest home prices in the country in the first quarter:
- San Jose-Sunnyvale-Santa Clara, Calif.: $2.02 million, up 9.8% annually
- Anaheim-Santa Ana-Irvine, Calif.: $1.45 million, up 6.2%
- San Francisco-Oakland-Hayward, Calif.: $1.32 million, up 1.5%
- Urban Honolulu, Hawaii: $1.165 million, up 7.3%
- San Diego-Carlsbad, Calif.: $1.04 million, up 5.7%
- Salinas, Calif.: $954,700, up 6.2%
- San Luis Obispo-Paso Robles, Calif.: $953,400, up 4.8%
- Oxnard-Thousand Oaks-Ventura, Calif.: $931,500, up 2.5%
- Naples-Immokalee-Marco Island, Fla.: $865,000, up 1.8%
- Los Angeles-Long Beach-Glendale, Calif.: $862,600, up 4.8%
You can always see the latest housing data from NAR at nar.realtor/research-and-statistics.