")


In 2022, affordability issues and the ability to work remotely drove 8.2 million Americans to move to different states. In this analysis, we delve into the most popular relocation destinations among households, encompassing both states and the 174 largest metropolitan areas in the country. We investigate the migration flows to identify which states and areas households chose to leave in favor of others.
Migration Flows Between States
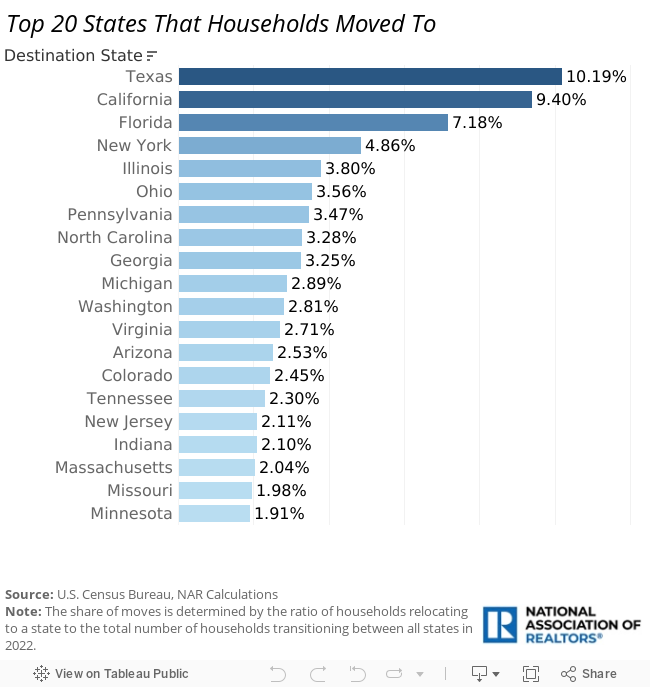
Based on the Census Bureau’s 2022 American Community Survey (ACS), Texas, California, and Florida were the most popular states for relocating households.
Texas saw movers coming mostly from California (2.57%), Florida (1.12%), and New York (0.83%). This doesn’t come as a surprise, considering that the median property value in Texas that year was $275,436 compared to $716,144 in California, $354,531 in Florida, and $402,584 in New York.
Florida saw households coming from New York (3.09%), New Jersey (1.73%), and California (1.70%). Some households from Texas (1.15%), New York (1.10%), and Florida (0.85%) moved to California that year despite the high property values, possibly to pursue employment opportunities.
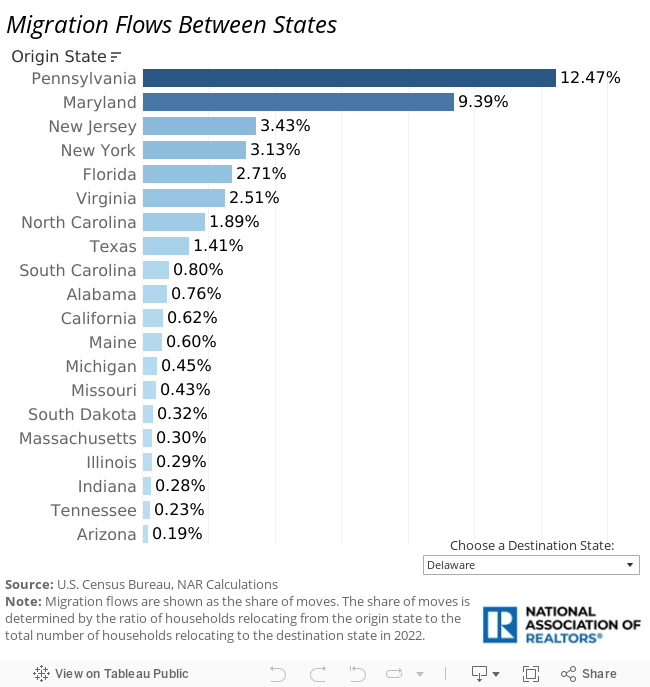
In other cases, Americans didn’t want to move across the country and preferred to relocate between neighboring states. For instance, despite Maryland’s higher property values ($389,959) compared to Virginia ($367,338) and Pennsylvania ($245,246), 3.34% of households relocating to Maryland originated from the District of Columbia, followed by 3.20% from Virginia and 2.52% from Pennsylvania.
In Oklahoma, 4.20% of households moved from Texas; in Alabama, 3.21% originated from neighboring Georgia. The trend was prominent in smaller states, too. For example, Connecticut experienced a relatively large influx of movers from New York (11.61%), while Delaware predominantly saw inbound movers coming from Pennsylvania (12.47%).
To see the migration flows between states, choose a destination state from the dropdown menu on the bottom right:
Migration Flows Between Metropolitan Areas
Among the 174 largest metropolitan areas in the country, the top destinations for households were New York-Newark-Jersey City, NY-NJ-PA; Los Angeles-Long Beach-Anaheim, CA; and Chicago-Naperville-Elgin, IL-IN-WI.
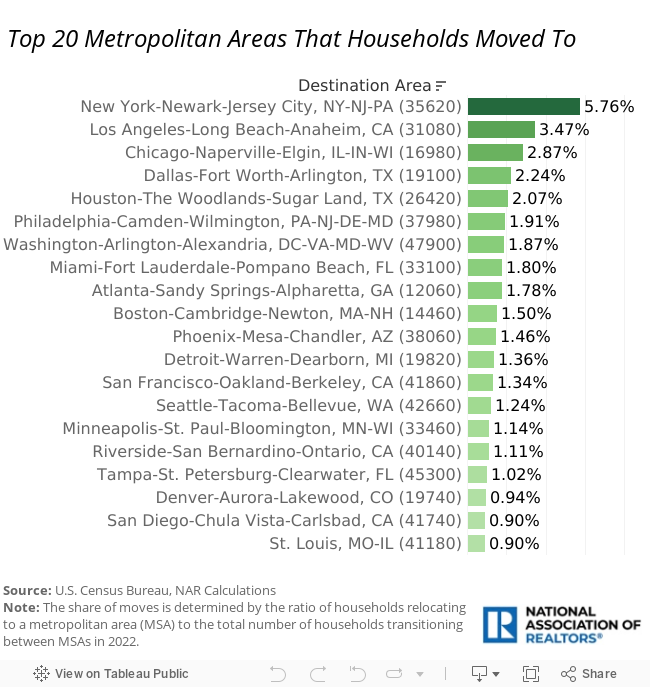
In the New York area, most movers (0.01%) originated from other metropolitan areas within the state, while in the Chicago area, households relocated mostly from different areas in Ohio (0.04%) and Arizona (0.04%). In the Los Angeles area, most households relocated from the more distant Pheonix-Mesa-Scottsdale, AZ area (0.03%), with smaller proportions originating from other areas in California, such as Sacramento-Roseville-Folsom (0.01%) and Napa (0.01%).
Other notable areas include Washington-Arlington-Alexandria, DC-VA-MD-WV, where the same proportion of households (0.06%) relocated from the nearby Winchester, VA-WV; Hagerstown-Martinsburg, MD-WV; and Cumberland, MD metro statistical areas.
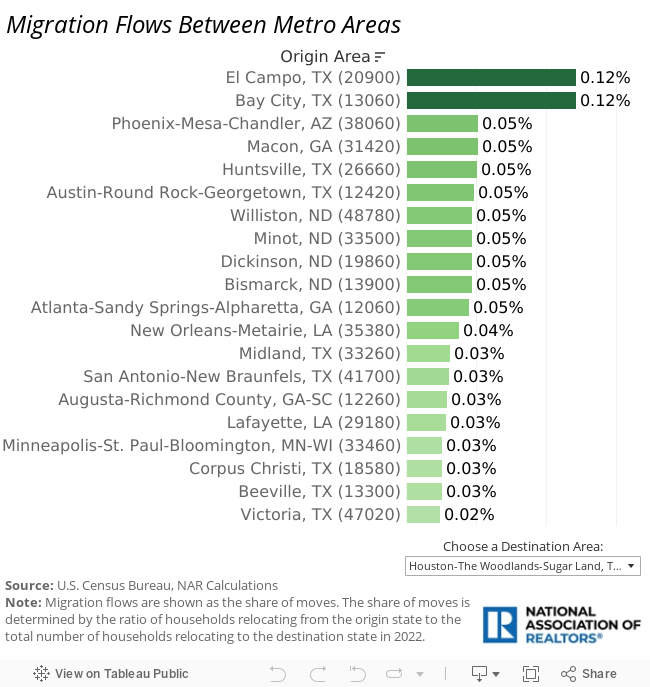
In Houston-The Woodlands-Sugar Land, TX, many households opted to remain within Texas. For example, households from El Campo (0.13%) and Bay City (0.12%) chose this larger metropolitan area as their new home. Additionally, a smaller percentage relocated from Pheonix-Mesa-Chandler, AZ (0.05%).
To see the migration flows between metropolitan areas, choose a destination area from the dropdown menu on the right: