

")


Please note: The data visualization embeds on this page are best viewed on a laptop or desktop computer.
Since early spring, NAR has been monitoring unemployment insurance claims data from the U.S. Department of Labor (DOL). This data, which includes the number of initial and continued unemployment claims, is the timeliest source of labor market indicators that we have, especially during a time when the Bureau of Labor Statistics is not publishing national employment figures.
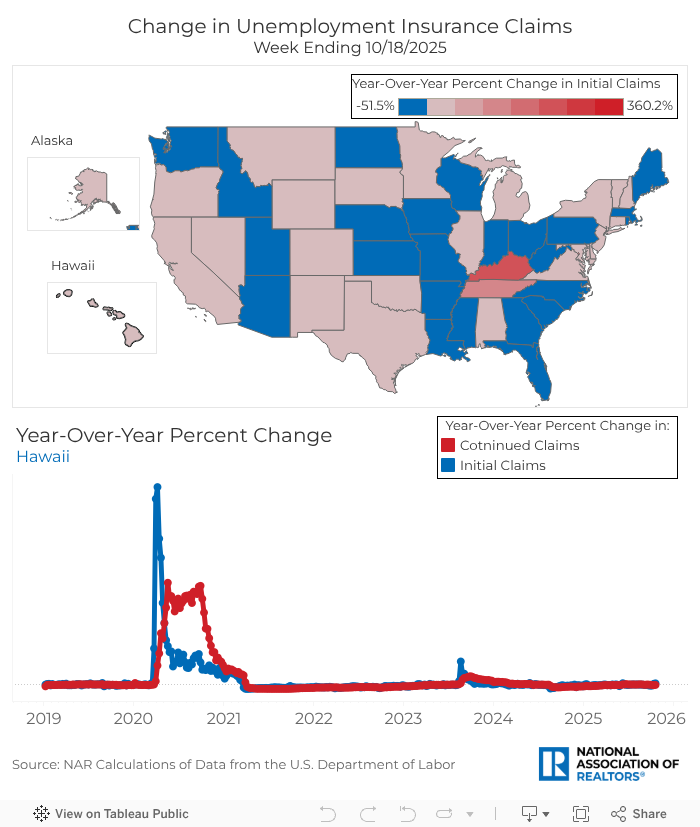
According to the most recent data released, during the week of October 18, only 16 states saw a rise in initial claims (from the prior week), while continued claims rose in 35 states.
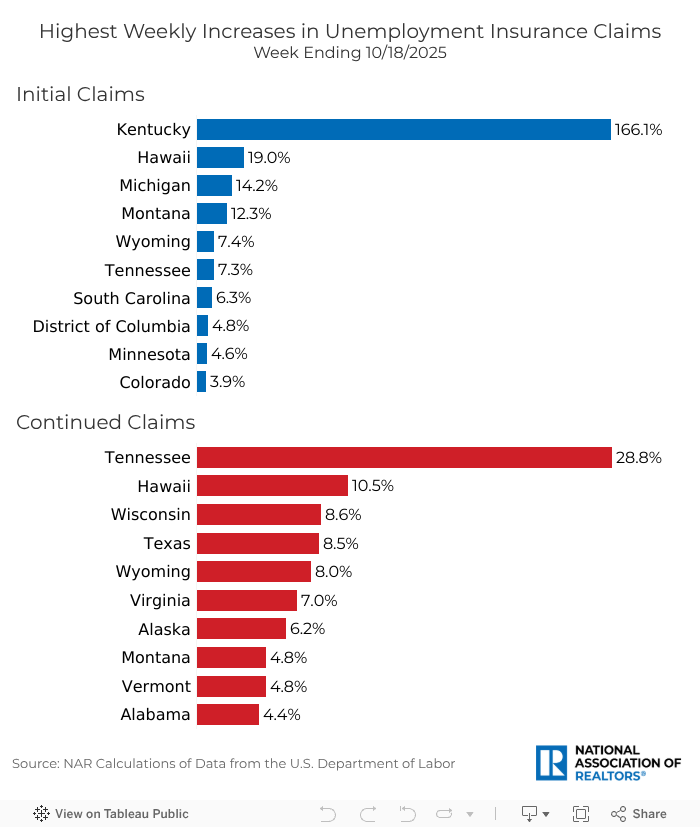
Key observations on initial claims1:
- Kentucky experienced the largest weekly increase in initial claims, rising by 166.1%, from 1,934 to 5,146 claims in the week between October 11-18.
- Following Kentucky, Hawaii saw an increase of 19%, Michigan rose by 14.2%, and Montana by 12.3%.
- In contrast, Virginia saw the largest decline that week, with initial claims falling by 27.5%.
- The decline in Virginia was followed by declines in Indiana (-23.6%), Rhode Island (-18.4%), and Utah (-17.8%).
Key observations on continued claims2:
- In the same week, continued claims increased the most in Tennessee, rising by nearly 30%.
- Hawaii (+10.5%), Wisconsin (+8.6%), and Texas (+8.5%) followed with significant increases in continued unemployment.
- While experiencing a sharp rise in new claims, Kentucky saw the largest drop in continued claims, declining by 16.3%.
- Kentucky was followed by smaller decreases in Indiana (-4.2%), Georgia (-3.9%), and Arizona (-2.1%).
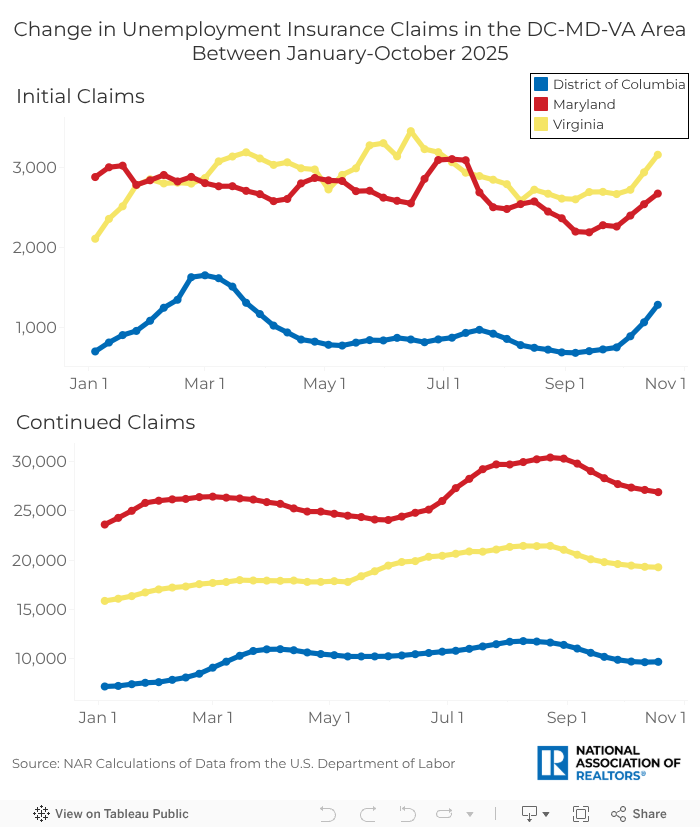
The federal government continues to see significant job losses, impacting workers in the nation's capital and nearby regions. Weekly data shows initial claims increased in the District of Columbia (+4.8%) but decreased in Maryland (-6.7%) and Virginia (-27.5%). However, continued claims increased in the District (+3.4%) and in Virginia (+7.0%), and decreased only slightly in Maryland (-0.1%). Overall, the four-week average shows that the number of workers applying for unemployment benefits continues to climb in all three of the areas, while continued claims are beginning to ease in Maryland and Virginia.
It is difficult to determine the underlying long-term trend this data aims to reveal without examining the growth rates of initial and continued claims at the national level. Nevertheless, it's clear that workers in the District of Columbia continue to be affected the most in the DC-MD-VA area.
To see how unemployment benefits have changed in your market, select a state on the map below:
1 Initial claims refer to the number of new jobless claims filed by U.S. workers seeking unemployment benefits.
2 Continued claims represent the number of people still receiving unemployment benefits after filing their first claims.
Advertisement

Anat Nusinovich
Anat Nusinovich is an economist for the National Association of REALTORS®.