Based on REALTORS® who reported about their transactions in August 2018, home buying activity slowed compared to the level of activity one year ago, according to the August 2018 REALTORS® Confidence Index Survey. The REALTORS® Buyer Traffic Index[1] slid to 57 in August 2018 from 69 one year ago. To be clear, homebuying activity was still broadly “stronger” than “weaker” (index is above 50), but the lower value of the index indicates a smaller fraction of respondents reported “stronger” conditions in August 2018 compared to the fraction who reported “stronger” conditions in August 2017.
The REALTORS® Seller Traffic Index remains below 50, which means more respondents reported “weaker” than “stronger” seller traffic in August 2018 compared to the level of selling activity one year ago. Lack of supply remains the major obstacle to homebuying and the factor driving up prices and eroding home affordability.

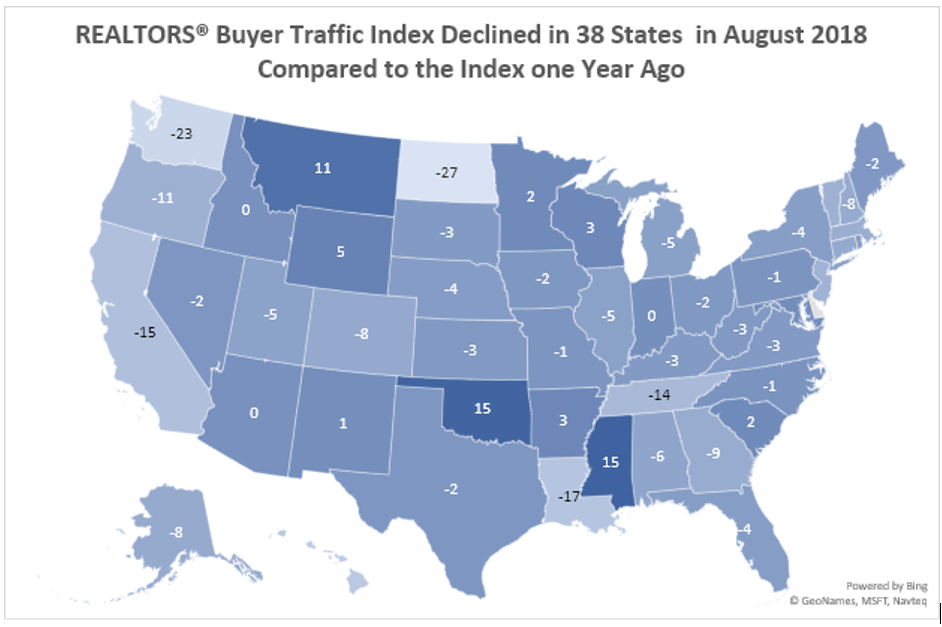
The REALTOR® Buyer Traffic Index pertaining to buyer traffic conditions in June-August 2018 (relative to one year ago) declined in 38 states compared to values of the index pertaining to buyer conditions in June-August 2017, with large declines in California (-15), Washington
(-23), North Dakota (-27), Louisiana (-17), Tennessee (-14), and New Jersey (-11) and Vermont (-11).

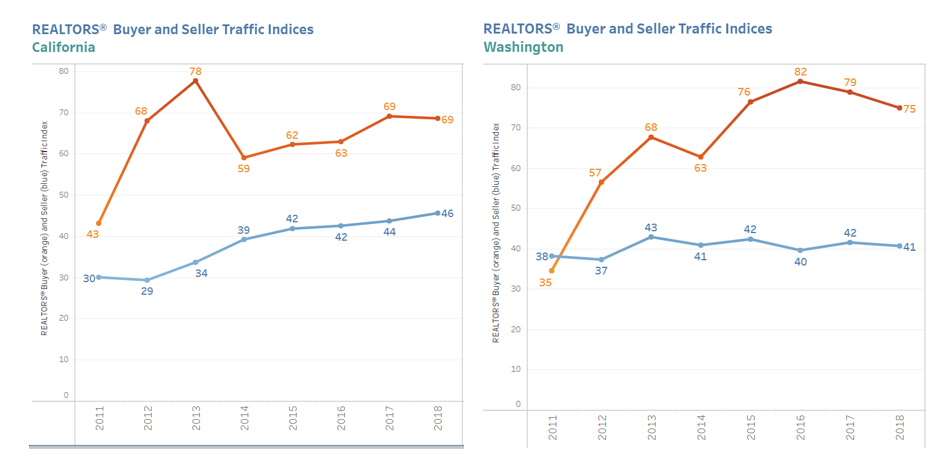
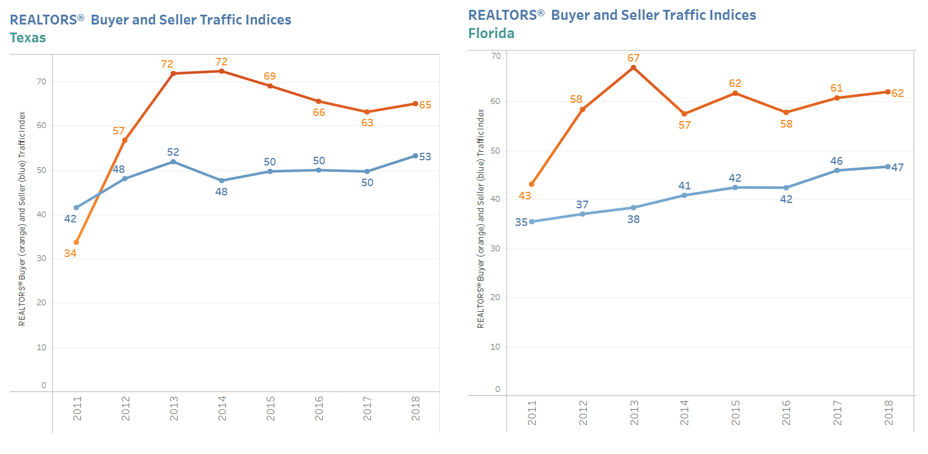
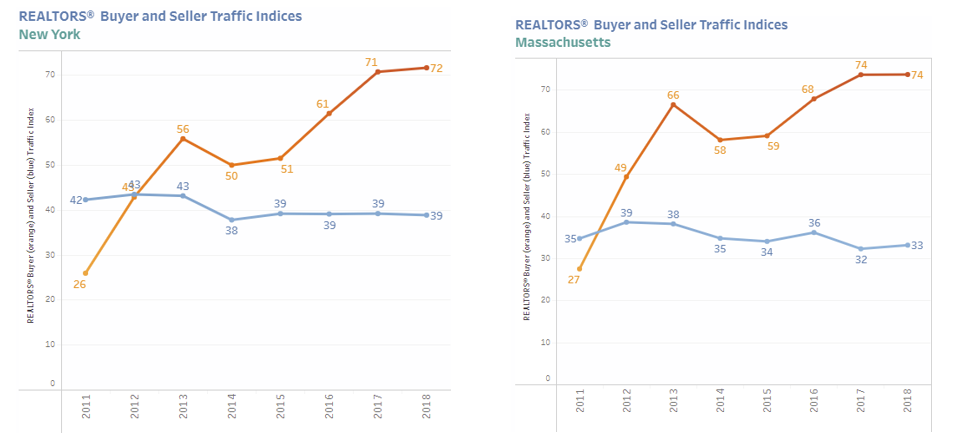
In major states such as California, Washington, Texas, Florida, New York and Massachusetts, homebuying has moved slightly downwards or remained flat during January-August 2018 compared to full year 2017, based on the average of the monthly REALTORS® Buyer Traffic Index (see charts and the data visualization tool below). Because employment is still rising strongly, the slowdown in homebuying may likely be because of higher home prices and higher mortgage rates. In August 2018, the typical monthly mortgage payment was $95 more compared to the payment in August 2017.[2] The REALTORS® Seller Traffic Index indicates that supply has been modestly increasing, although supply is still tight in many areas (indices below 50).


Use the data visualization tool below to view how buyer and seller traffic over time across states.
About the Realtors® Confidence Index Survey
The RCI Survey gathers information from REALTORS® about local market conditions based on their client interactions and the characteristics of their most recent sales for the month. The August 2018 survey was sent to 50,000 REALTORS® who were selected from NAR’s1.3 million members through simple random sampling and to 8,386 respondents in the previous three surveys who provided their email addresses. There were 4,639 respondents to the online survey which ran from September 1-11, 2018. NAR weights the responses by a factor that aligns the sample distribution of responses to the distribution of NAR membership. The REALTORS® Confidence Index is provided by NAR solely for use as a reference. Resale of any part of this data is prohibited without NAR's prior written consent. For questions on this report or to purchase the RCI series, please email: Data@realtors.org
[1] In a monthly survey of REALTORS®, respondents are asked “Compared to the same month last year, how would you rate the past month's traffic in neighborhood(s) or area(s) where you make most of your sales?” Respondents rate buyer traffic as “Stronger” (100), “Stable” (50), or “Weaker” (0) and the responses are compiled into a diffusion index. An index greater (lower) than 50 means more (fewer) respondents reported “stronger” than “weaker” conditions in the reference month compared to the conditions in the same month last year. A higher value of the index in any reference month compared to the value in another reference month means a larger fraction of respondents reported “stronger” conditions in the former period than the fraction of respondents who reported “stronger” in the latter period.
[2] Based on a 10 percent down payment on a home priced at $264,800 in August 2018 with 30-year fixed mortgage rate of 4.88 percent and a home priced at $251,800 in August 2017 with a 30-year fixed mortgage rate of 4.25 percent.


