


")


Please note: The data visualization embeds on this page are best viewed on a laptop or desktop computer.
NAR's quarterly Housing Shortage Tracker index is a forward-looking indicator that calculates how many new building permits are issued for every new job created in selected major metropolitan areas. The index helps identify areas with the highest deficit of single-family homes while providing insight into what affordability might look like in those areas in the coming months. A high index indicates that more jobs are being created than homes in a specific area, while a negative ratio shows that there were no job losses in that area. Historically, one single-family building permit is issued for every two new jobs.
In June 2025, nearly 90% of the major market areas that NAR tracks in the index had narrowed the housing supply-demand gap by issuing more single-family building permits.
Among the areas that saw the most improvement in their housing deficit:
- Boulder, CO, experienced the most significant improvement, decreasing its index by 89.2% and issuing one building permit for each new job created. This represents a notable shift from June of last year, when Boulder issued one permit for every six new jobs.
- Additional major markets in the West showed improvement, including four in California: Santa Maria-Santa Barbara (-78.9%), Vallejo-Fairfield (-77.1%), Los Angeles-Long Beach-Anaheim (-73.5%), and Oxnard-Thousand Oaks-Ventura (-68.1%).
- Notably, Springfield, IL, issued one permit for every three new jobs in June 2025, a significant improvement from one permit for every 17 new jobs in June 2024.
- Atlantic City-Hammonton, NJ, and Milwaukee-Waukesha-West Allis, WI, reached a balanced ratio of two in June.
By the end of the second quarter of 2025, about 45% of the market areas had a housing shortage index of two or lower. This is a noteworthy boost in permit-issuing activity compared to the same time last year when only approximately 20% of the areas were near a balanced index. However, some markets were still slow to adjust.
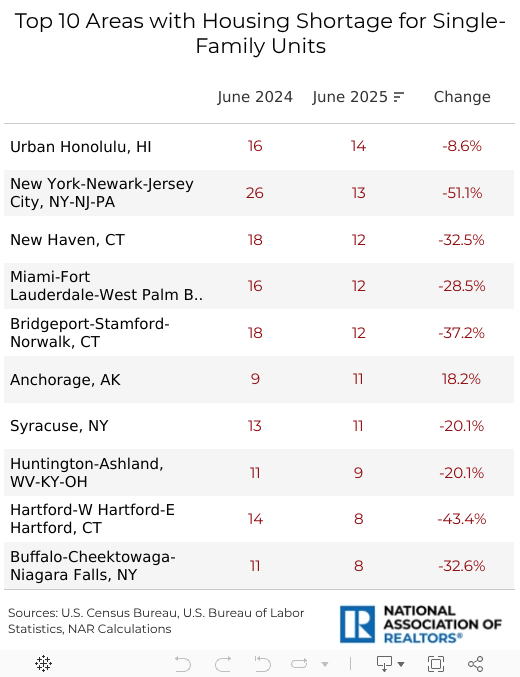
Among the areas with the greatest housing shortages:
- Urban Honolulu, HI, continued to have the highest housing deficit in the nation, with one permit issued for every 14 new jobs. Nonetheless, this marked the second consecutive quarter of improvements in Honolulu's index, which saw an 8.6% decline this month and roughly a 35% decline at the end of the first quarter.
- The most notable change was in the New York-Newark-Jersey City, NY-NJ-PA market, which lowered its index by 51.5%, from 26 in June 2024 to 13 in June 2025.
- Three areas in Connecticut were ranked among those with the highest indexes: New Haven (12), Bridgeport-Stamford-Norwalk (12), and Hartford-West Hartford-East Hartford (8).
- As in the previous two quarters, Anchorage, AK, remained the only area that showed no improvement over the past 12 months. In June 2025, it experienced an 18.2% increase in its housing shortage index.
On a national level, the housing market continues to grapple with affordability issues. In June, the median existing-home price reached a record high of $435,300, marking the 24th consecutive month of year-over-year increases. The primary reason behind these record-breaking price increases is the low supply of housing.
Encouragingly, NAR is seeing more metropolitan areas moving toward a balanced ratio of permits to jobs compared to last year. As the housing shortage index is a forward-looking indicator, it offers insight into the future inventory in these areas, since building permits will eventually translate into new homes. As many metropolitan areas across the country strive to narrow the gap between housing supply and demand, they become more affordable for potential home buyers.
In the second half of 2025, NAR anticipates the median single-family home price to rise moderately by 1%, alongside decreases in mortgage rates and continued job gains. If local markets increase the construction of new homes, NAR expects to see more buyers at different levels entering the markets.
Visit the Housing Shortage Tracker page to learn more about how the data has changed in your area during Q2 2025.
Advertisement

Anat Nusinovich
Anat Nusinovich is an economist for the National Association of REALTORS®.