In late January, the new Trump administration froze a number of policy changes made in the waning days of the Obama Presidency. One such change, a 25 basis point decrease in the mortgage insurance premium (MIP) charged by the Federal Housing Administration (FHA), was previously analyzed by NAR Research. Here we report local impacts of the change, which are large in both high cost areas and in areas where FHA usage is highest.
NAR Research previously estimated that 30,000 to 40,000 home purchases would be lost in 2017 and another 750,000 to 850,000 homebuyers would face higher costs. These effects were re-estimated at the local level using 2015 HMDA figures for purchase mortgages. The results vary widely across the country.
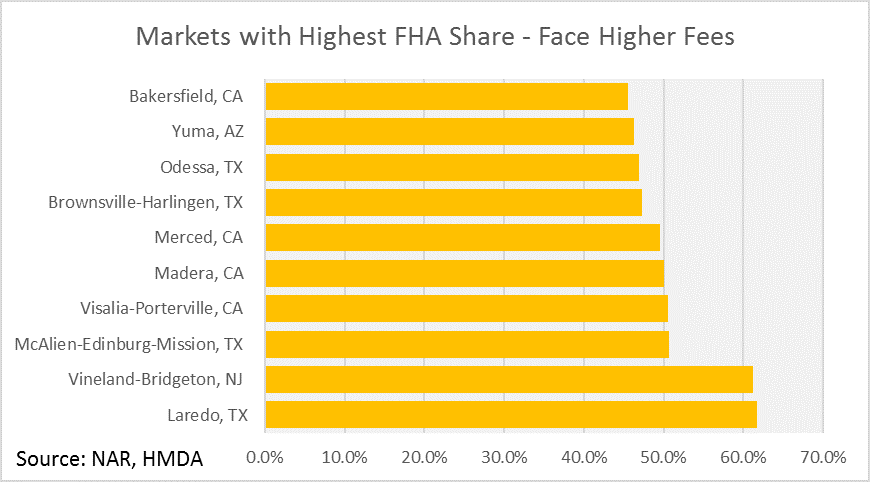
Markets with high shares of purchase mortgages financed with FHA support will experience the broadest impact of the higher MIP fees. The top 10 markets in terms of FHA share were in smaller communities in Texas and California along with wide swaths of the Southeast and “rust belt” (see map below). Since more than 40 percent of home purchases in the top 10 markets were financed with FHA backing, these markets would have received the broadest boost to affordability from the lower monthly payments. The most robust impacts are likely to be felt in Laredo (TX), Vineland-Bridgeton (NJ), and McAlien-Edinburg-Mission (TX). Nationally, 25.3 percent of purchase mortgages were backed by the FHA in 2015.

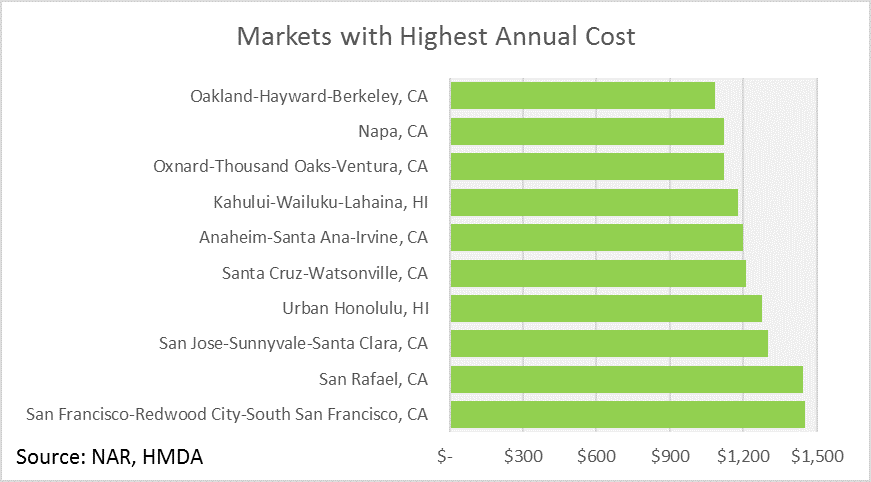
However, because the MIP is charged on the outstanding mortgage balance, buyers utilizing the FHA in markets with the highest home prices would forgo the greatest reduction in annual cost. Markets in California and Hawaii dominate this list. In 2015, the average homebuyer in San Francisco who financed their purchase with an FHA loan would have saved nearly $1,450 annually.

A 25 basis point fee reduction at the FHA would have a broad benefit. In particular, those markets with the highest cost and greatest dependence on FHA financing would feel the pinch. Curious how your market stacks up? The chart below depicts the FHA share of purchase mortgages and annual savings from a 25 basis point MIP reduction in more than 300 metropolitan areas across the country.


