


Share
Please note: The Tableau data visualization embeds in this post are best viewed on a laptop or desktop computer.
Mortgage Interest Rates
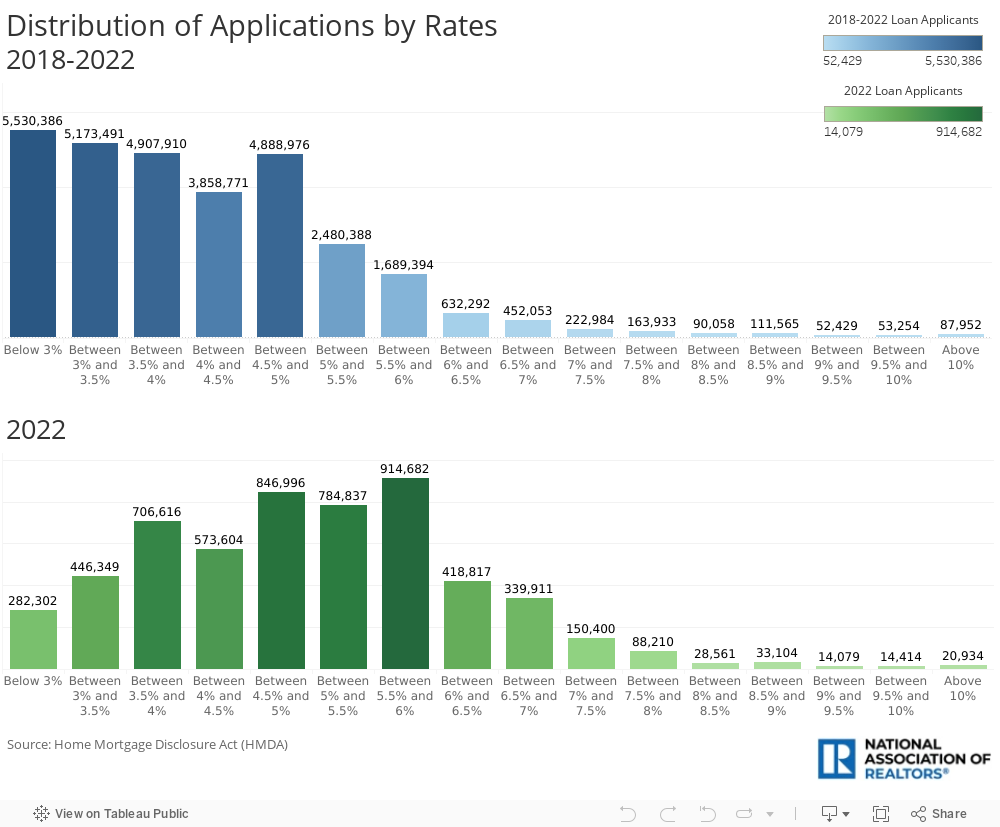
Between 2018 and 2022, most applicants (5,530,386) received a mortgage rate below 3%. However, the average U.S. rate between those years was 4.22%, and only 3,858,771 applicants received a rate close to the average. The lowest number of applicants (52,429) received a rate between 9%-9.5%, and 87,952 applicants received a rate of 10% and above.
In contrast, only 282,302 applicants received a rate below 3% in 2022. That year, most applicants (914.682) secured a rate between 5.5% and 6% on their loans, a substantially higher rate than the previous years, because of the Federal Reserve’s rate hikes. In addition, 846,996 applicants received a rate between 4.5% and 5%, and only 20,934 applicants received a rate above 10%.
Mortgage Approval Rates
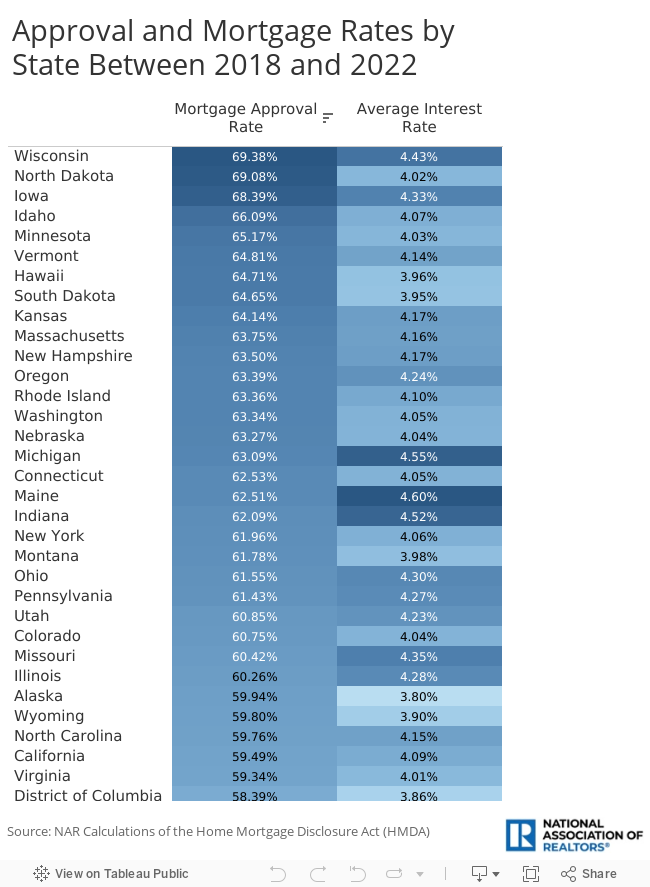
Over the last five years, Wisconsin was in the lead with the highest mortgage approval rate, with 69.38% of the applications being approved for a loan. Following Wisconsin are North Dakota (69.08%) and Iowa (68.39%). On the other end, Mississippi (52.14%), Texas (52.28%), and Louisiana (52.47%) had the lowest approval rates. Nevertheless, all 50 states had approval rates above 50%. Average interest rates on loans ranged between 3.80% and 4.60%, with Maine (4.60%) as the state with the highest rate and Alaska (3.80%) as the state with the lowest rate. It’s not clear if there is a direct relationship between interest rates and loan approvals; however, in some states (including large states like Texas, Florida, Georgia, and New Jersey), low mortgage approval rates coincided with higher interest rates. This makes sense as higher mortgage rates make loans less affordable for Americans, and factors like median applicant income and property value cause this relationship to differ between states.
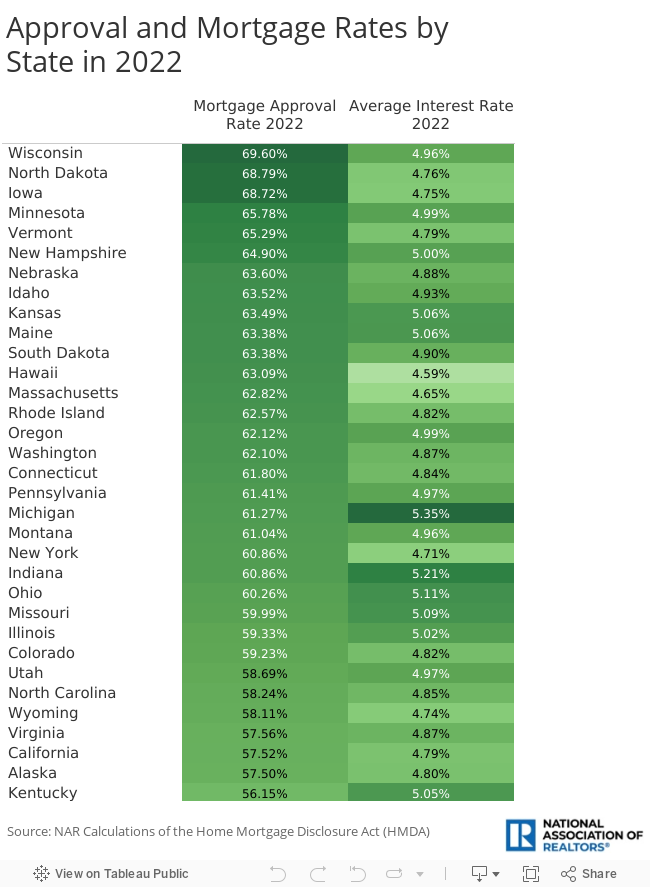
The data from last year follows the same trend, with Wisconsin (69.60%), North Dakota (68.79%), and Iowa (68.72%) as the leading states in loan approvals. This year, mortgage approval rates in some states went below 50%, including Mississippi (48.89%), Louisiana (49.21%), and Texas (49.53%). Loan applicants in these states received higher rates (5.14%, 5.09%, and 4.98%, respectively) compared to the previous years.
Insights from the Historical Data
The number of approved mortgage applications has been declining in the last decade. With events like the Great Recession and the COVID-19 pandemic, the U.S. total approval rate has declined from 73.73% in 2004 to 53.02% in 2022, almost as low as in 2011 (48.44%). Choose a state from the dropdown menu below to see how the rates have changed over the years.


Anat Nusinovich
Economist
Anat Nusinovich is an Economist for the National Association of REALTORS®.
Search Economists' Outlook