


Share

Existing-Home Sales Housing Snapshot
Infographic
March 2024 brought 4.19 million in sales, a median sales price of $393,500, and 3.2 months of inventory. The median sales price is up 4.8% year-over-year, and inventory was up 0.5 months from March 2023.

Pending Home Sales Snapshot
Infographic
In February 2024, pending home sales rose 1.6% month-over-month.

Metro Areas With Largest Percent Gain in Existing Single-Family Home Home Price in 2023 Q4
Infographic
The top 10 metro areas with the largest year-over-year price increases all recorded gains of at least 14.8%.

The results of a poll conducted in April 2023 of 2,000 adults in the fifty-largest metro areas found that demand for living in a walkable community remains robust, following the Coronavirus pandemic.
Metro Areas With Largest Percent Gain in Existing Single-Family Home Home Price in 2023 Q1
Infographic
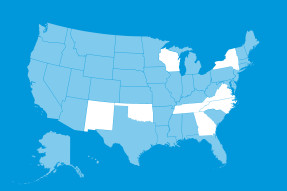
Three of the 10 metro areas with the largest percent gains in existing single-family home price in 2023 Q1 were in Wisconsin and North Carolina.
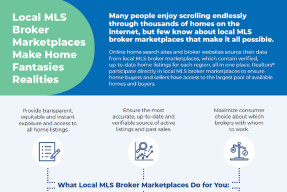
Local Broker Marketplaces Make Home Fantasies Realities

Why Hire an Agent Who is a REALTOR®
Infographic
Why Hire an agent who is a Realtor®?

There's much more to selling a home than some people think. But if you work with a Real Estate Agent who is a REALTOR®, selling a home is easy.

There's much more to buying a home than some people think. But if you work with a Real Estate Agent who is a REALTOR®, buying a home is easy.

Metro Areas With Largest Percent Gain in Existing Single-Family Home Home Price in 2022 Q4
Infographic
Seven of the 10 metro areas with the largest percent gains in existing single-family home price in 2022 Q4 were in Florida and North or South Carolina and the others were in New Mexico, Texas, and Wisconsin.