


Workforce is moving to less affordable areas
- In the last 12 months, most of LinkedIn members who lived in the 20 largest metropolitan areas moved from a more affordable place to a less affordable place.
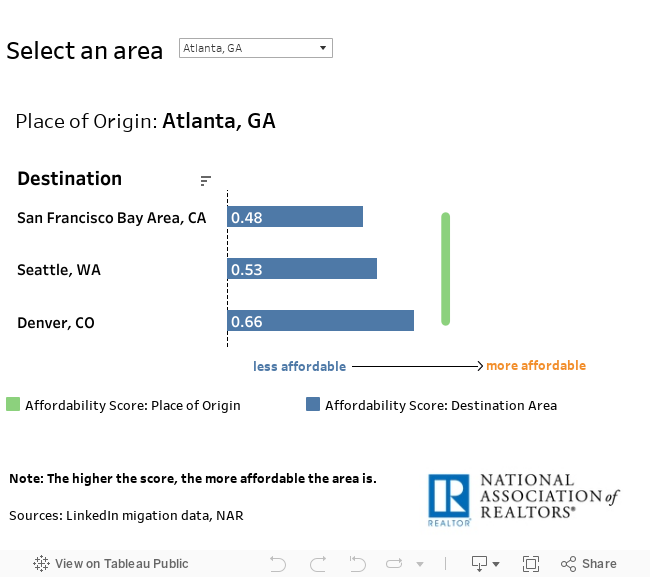
- Denver, San Francisco and Seattle were the top destinations for LinkedIn members.
Although housing affordability is still weakening in many local areas, particularly in the West, as a result of the ongoing supply and demand imbalances, a NAR analysis shows that many workers are actually moving to less affordable areas such as San Francisco and Seattle. According to LinkedIn migration data[1], in 13 of the largest 20 areas, a majority of the workforce moved from a less expensive place to a more expensive place.
For instance, the San Francisco area was the most popular destination for workers moving from Detroit. For every 10,000 LinkedIn members in Detroit, four members moved to the San Francisco area in the last 12 months. Based on the REALTORS® Affordability Distribution Curve and Score (RADCS), the affordability score for Detroit was 0.95 in September 2018 while the affordability score for the San Francisco area was 0.48. But what does this mean? The higher the score, the more affordable the area is. For example, a household earning $100,000 in Detroit can afford to buy 72 percent of homes currently listed for sale while the same household can afford to buy only eight percent of homes for sale in San Francisco area.
San Francisco was also the top destination for workers from Philadelphia. Although Philadelphia is more affordable than San Francisco, for every 10,000 LinkedIn members in Philadelphia, nearly three members moved to San Francisco in the last 12 months. The visualization below allows you to compare the affordability of the area of origin with the affordability of the destination area. Among the 20 largest areas, see in which areas workers decided to move to a less affordable place. Please bear in mind that the higher the score, the more affordable the area is.
While people in general are moving less these days, we also see that fewer people move for an employment-related reason. However, due to a strong economy, it seems that people get better jobs and decide to move to the most attractive areas across the United States. The good news is that new construction is increasing even in areas with serious housing supply issues. For example, the three-year issuance of single-family permits increased two percent in the San Francisco metro area. Based on the NAR Housing Shortage Tracker, when we compare permit issuance with employment growth, we see that in November 2018 a single-family permit was issued for every 12 new jobs compared to 15 jobs in November 2017.
[1] LinkedIn Workforce Report (October 2018).
