Home prices continue to increase although the pace of price appreciation has slowed. As of June 2018, the national median sales price of existing homes sold rose to a peak of $276,900, the highest level since 2001 when NAR started tracking this data. However, the pace of appreciation has been slowing. In June 2018, the national median sales price rose 5.2 percent on a year-on-year basis (2.2 percent on an inflation-adjusted basis), a slower rate of growth compared to the price appreciation of near or above 10 percent in 2013.

The question is: will home prices continue to increase? One way to think about this is to compare the price appreciation with days on market. If properties continue to sell at a faster pace, this means that demand continues to outpace supply, and there continues to be an upward pressure on prices. However, if properties are increasingly staying on the market longer, then this means that supply is starting to outpace demand, causing prices to fall. As of June 2018, the median list price increased compared to one year ago in 419 metro areas tracked by Realtor.com (414 in June 2017). Meanwhile, properties sold faster compared to one year ago in 495 metro areas (395 in June 2017).
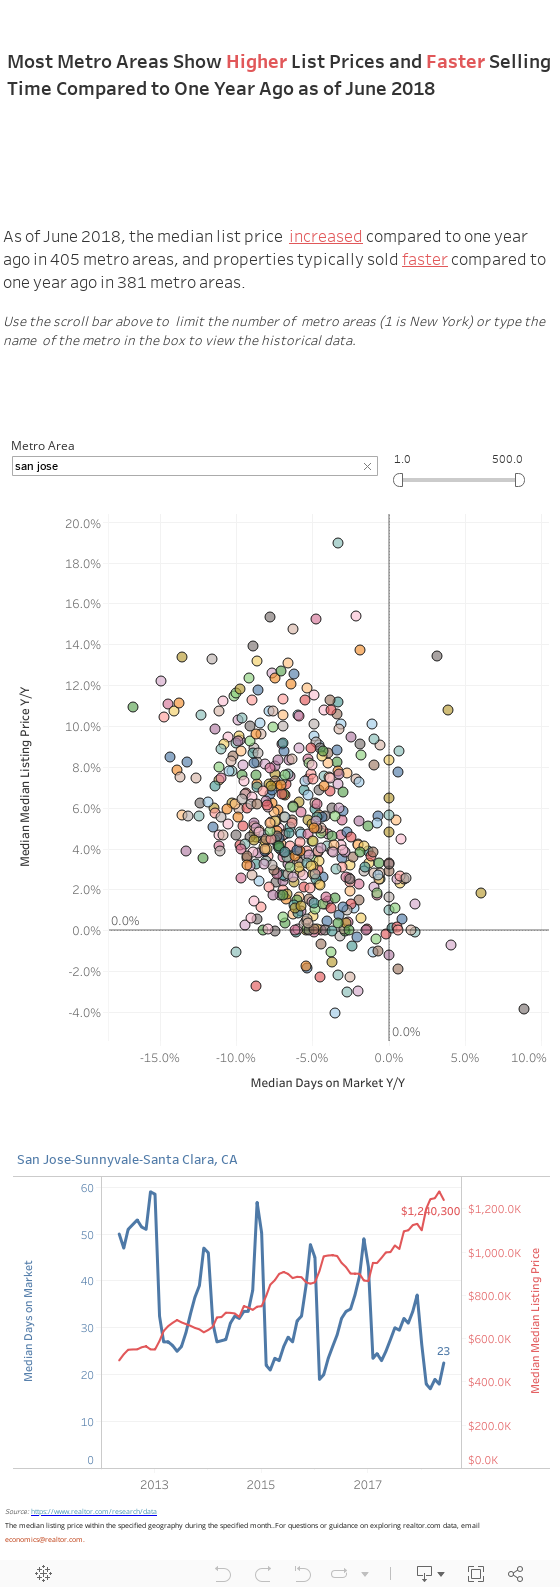
The data visualization below shows the year-on-year change in median list price (Y-axis) against the year-on-year change in days on market (X-axis). Most metro areas lie on the upper left quadrant where the median list prices rose and the median days on market fell in June 2018 compared to one year ago. There are only three metro areas where days on market rose and median list prices fell: Johnston, PA; Enid, OK, and Minot, ND.
In the high price metro areas, the median list prices rose compared to one year ago, but they have slightly declined compared to May 2018 levels. In San Jose-Sunnyvale, the median list price rose compared to one year ago (14.7 percent), but the median list price decreased compared to the May 2018 level (-3 percent). In San Francisco-Oakland-Hayward, CA, median prices rose compared to one year ago (8.7 percent) but also slightly declined from the May 2018 level (-0.4 percent). In Los Angeles-Long Beach-Anaheim, CA, the median list price also rose compared to one year ago (5.2 percent) but declined compared to the May 2018 level (-0.5 percent).
In summary, in many areas, demand is still outpacing supply, so there is still upward pressure on prices for now in many metro areas, although prices have started to trend downwards modestly in high-price metro areas (e.g., San Jose, San Francisco, Los Angeles). Affordability challenges, rising interest rates, and the modest increase in housing starts are likely exerting a downward pressure on prices. However, over the longer-term, there is still the upward demographic demand pressure from those in the 35-44 age groups (mostly millennials) who will increasingly get older, get married, have better incomes, and start forming households and buying homes. The U.S. Census Bureau projects the number of 35-44 year-old adults to increase from 41.3 million in 2018 to 47.2 million in 2028.