


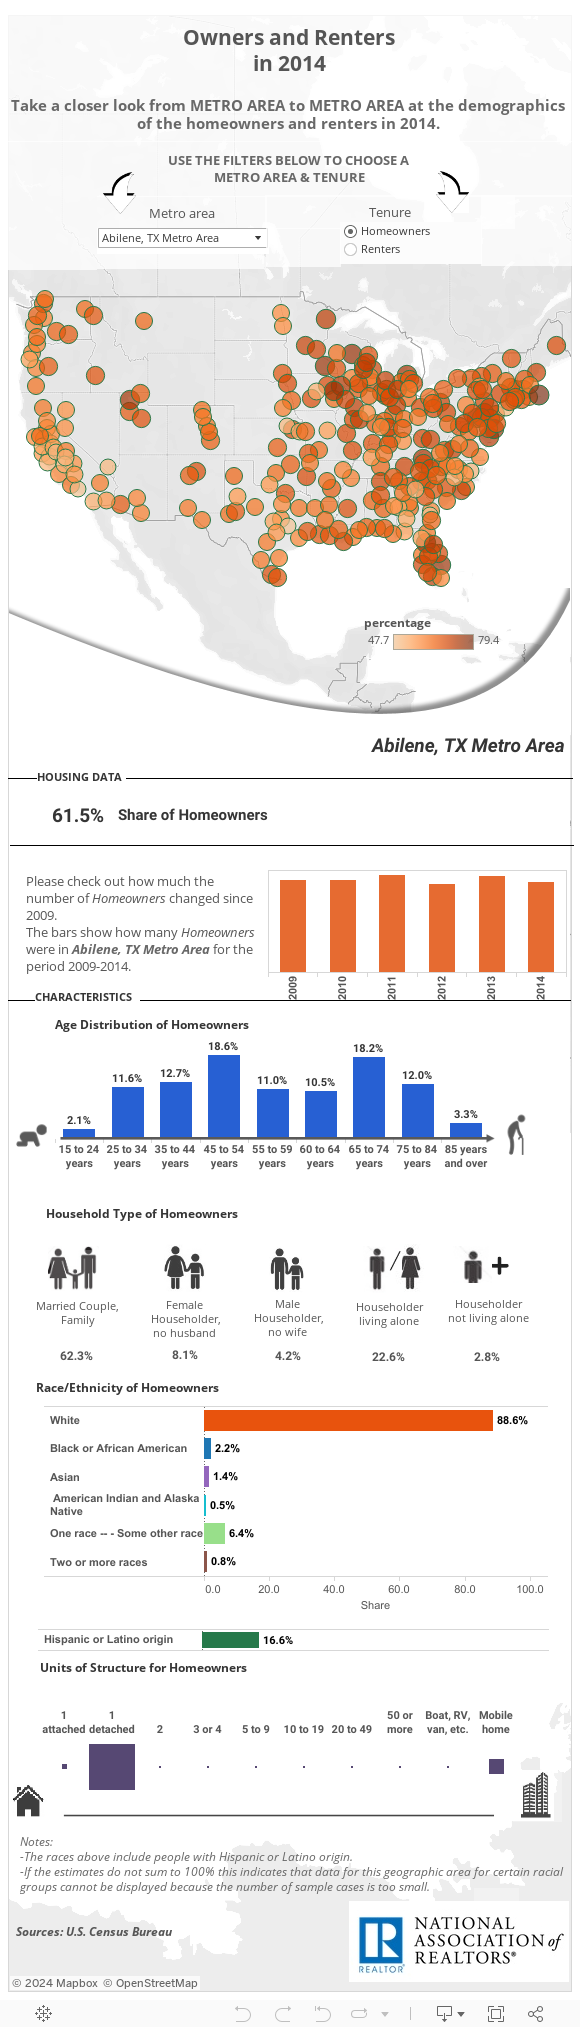
Based on the American Community Survey 2014, the typical homeowner is 45-54 years old, married, and lives in a single-family detached unit. In contrast, the typical renter is 25-34 years old living alone in multi-unit structures (mostly with 5-9 units).
Identifying specific characteristics of homeowners and renters can help us understand an individual’s tenure choice: whether they decide to rent or to own. Households locate across the country based on individual’s preferences for certain neighborhoods, walkability, access to public transport, social characteristics and many other factors. This means that the homeownership rate vary from metro area to metro area. Indeed, the homeownership rate is less than 50% in the following four metro areas: College Station-Bryan, TX (47.7%), Los Angeles-Long Beach-Anaheim, CA (48.3%), Hinesville, GA (48.5%), Merced, CA (49.8%). Demographics may give an answer to why those metro areas had more renters than owners.
Let’s examine the demographics for both owners and renters at the metropolitan level.
Age
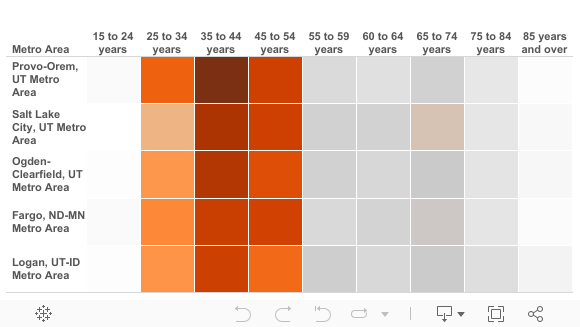
Homeowners: The largest share of homeowners falls within the age bracket between 45-54 years old in 2014. However, there are metro areas where the largest share of homeowners is in a younger age bracket. In our recent study “Best Purchase Markets for Aspiring Millennial Homebuyers”[1], we identified the top metro areas where millennials move to and we concluded that these markets are well-positioned to experience a rise in first-time home buyers. Indeed, we see that in most of those metro areas the largest share of homeowners is in the 35-44 year age-group instead of the 45-54 year age-group. This seems to occur because of the influx of millennials who increase the share of younger owners. Here is the list of metro areas with largest shares of homeowners in the age-range 35-44 years:
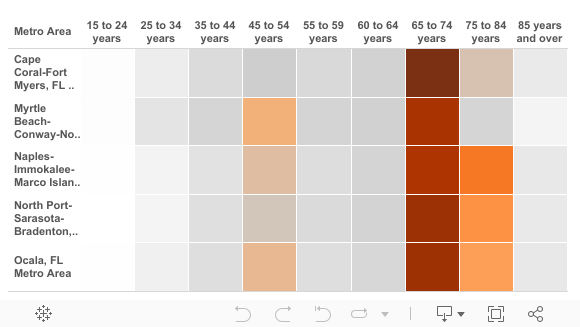
On the other hand, baby boomers seem to move to sunnier metro areas to retire. Here is the list of some metro areas where the largest share of homeowners is 65-74 years old (above the typical age):
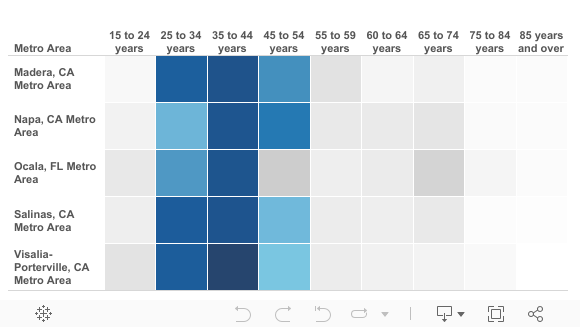
Renters: A typical renter is 25-34 years old. However, the largest share of renters rises to the 35-44 year age range in the following areas. Those metro areas seem to experience an increase in homeownership as renters get closer to the typical age of owners.
Race:
Homeowners: There are metro areas which are more diverse than other areas. Diversity is higher in California, Hawaii and the metro areas in the South. The smaller the share of the largest group, the more diverse metro area is. For instance, in San Jose, CA that is 58% White (the largest group), 34% Asian, 1% Black owners is more diverse than Atlanta, GA that is 68% White, 25% Black owners and 5% Asian.
Based on the second axiom of urban economics, change is self-reinforcing, thus it is expected that the diversity of the following areas will continue to increase. Here is a list of the most diverse metro areas in homeowners:

Washington, DC is also one of the most diverse metro areas with 66% White, 21% Black, 9% Asian owners.
Let’s see which metro areas had the highest concentration of home owners of each race in 2014:
White (including Hispanic or Latino origin)
| Metro Area | Share of Owners |
| Dubuque, IA |
98.6% |
| Pittsfield, MA |
98.4% |
| Fond du Lac, WI |
98.3% |
| La Crosse-Onalaska, WI-MN |
98.0% |
| Bangor, ME |
97.8% |
Black (including Hispanic or Latino origin)
| Metro Area | Share of Owners |
| Pine Bluff, AR |
42.0% |
| Hinesville, GA |
39.7% |
| Jackson, MS |
37.1% |
| Albany, GA |
36.9% |
| Memphis, TN-MS-AR |
34.7% |
Asian (including Hispanic or Latino origin)
| Metro Area | Share of Owners |
| Urban Honolulu, HI |
56.4% |
| San Jose-Sunnyvale-Santa Clara, CA |
33.8% |
| San Francisco-Oakland-Hayward, CA |
24.6% |
| Los Angeles-Long Beach-Anaheim, CA |
17.4% |
| Vallejo-Fairfield, CA |
13.9% |
Renters: While the national homeownership rate decreased for every race group from 2013 to 2014, the gap between the ownership rates for Blacks and Whites slightly increased from a year ago. Specifically in 2014, at national level, 41% of Black householders own a house versus 59% who rent. In contrast, 69% of White householders own a house while 31% who rent.
Here are the metro areas with the highest concentration of renters of each race in 2014:
White (including Hispanic or Latino origin)
| Metro Area | Share of Renters |
| Brownsville-Harlingen, TX |
94.8% |
| Bend-Redmond, OR |
93.8% |
| Coeur d'Alene, ID |
93.8% |
| Eau Claire, WI |
93.5% |
| Kingsport-Bristol, TN-VA |
93.5% |
Black (including Hispanic or Latino origin)
| Metro Area | Share of Renters |
| Albany, GA |
68.1% |
| Pine Bluff, AR |
66.9% |
| Jackson, MS |
66.6% |
| Florence, SC |
63.3% |
| Montgomery, AL |
60.9% |
Asian (including Hispanic or Latino origin)
| Metro Area | Share of Renters |
| Urban Honolulu, HI |
31.0% |
| San Jose-Sunnyvale-Santa Clara, CA |
29.7% |
| Ithaca, NY |
25.8% |
| San Francisco-Oakland-Hayward, CA |
19.6% |
| Champaign-Urbana, IL |
13.8% |
Household Type:
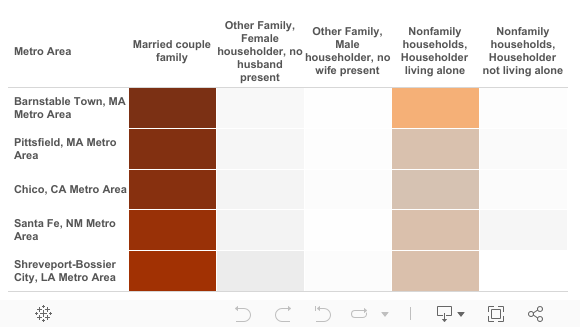
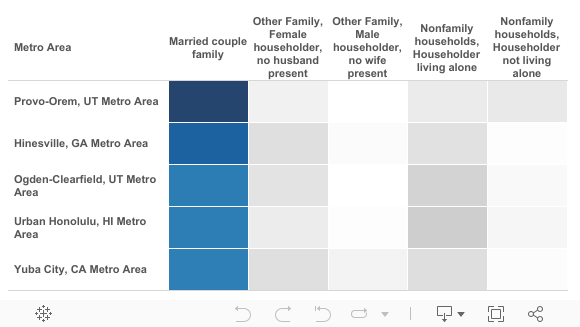
Homeowners: Homeowners are most commonly married couples. However, there are many people living alone who own a place as well. The metro areas below attract the most single owners:
Renters: In contrast, renters are more likely to be single. Here are the metro areas that buck the trend with the highest share of married couples who rent a house:
Units of structure:
Homeowners: While the vast majority of owners buy single family homes, housing units in multi-unit structures or essentially condominiums are their second choice. In some metro areas, the share of multi-unit owners is significantly high (28% of the total owners). Geographically, people tend to buy housing units in multi-unit structures in coastal and urban areas where density is high, affordability is low, and the gap between the price of a single family home and a condo is big. Here is the list of the metro areas with the highest share of owners of a housing unit in a multi-unit structure:
| Metro Area | Share of Ownersliving in multi-unit structure |
| Naples-Immokalee-Marco Island, FL |
27.8% |
| Urban Honolulu, HI |
26.6% |
| New York-Newark-Jersey City, NY-NJ-PA |
24.1% |
| Miami-Fort Lauderdale-West Palm Beach, FL |
23.6% |
| Boston-Cambridge-Newton, MA-NH |
18.1% |
Renters: On the other hand, the typical renter lives in a housing unit in multi-unit structure. However, in the following metro areas there are more individuals that rent a single family home than a housing unit in multi-unit structure.
| Metro Area | Share of Renters living in single family home |
| Madera, CA |
62.7% |
| Merced, CA |
57.5% |
| Modesto, CA |
55.6% |
| Visalia-Porterville, CA |
55.6% |
| Lawton, OK |
52.2% |
Note: If the estimates do not sum to 100% this indicates that data for this geographic area for certain racial groups cannot be displayed because the number of sample cases is too small.
