


In a monthly survey of REALTORS®, the survey asks, “Compared to the original listing price, at how much of a net discount or net premium did the property sell?”
According to a survey of REALTORS® who responded to the March 2018 REALTORS® Confidence Index Survey, 37 percent of properties that closed in February 2018 sold at or above the list price. One year ago, 35 percent sold at or above the list price, and during the months of January in 2012 through 2015, about one in four sold at or above the list price. Buyer demand continues to outpace supply of homes being listed for sale in the market, sustaining the upward pressure on home prices.

According to respondents who reported closing a sale, 17 percent of properties sold at a net premium in March 2018, an increase from the nine percent share in 2014 and 2015. Of properties that sold at a premium, 87 percent sold at 101 to 110 percent of the list price, seven percent were sold at a premium of 11 to 20 percent, and five percent were sold at more than 20 percent premium.

The price distribution continues to skew to the right. In 2012, 34 percent of properties were typically listed at $150,000 in 2012, but as of March 2018, only 22 percent of properties listed were typically at this price level.[1]
Use the data visualization below to view the median listing price of properties listed on Realtor.com in March 2018. Red areas are areas where the listing price is higher than the U.S. median sales price of all existing homes sold in March 2018, at $250,400. Hover on the map to see the distribution of listing prices from June 2012 through March 2018 on Realtor.com data.
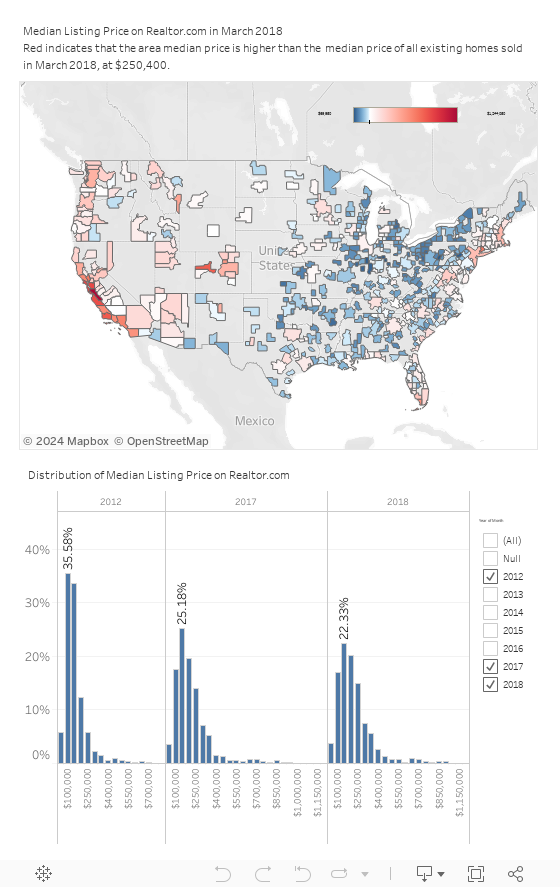
[1] To access Realtor.com data, go to https://www.realtor.com/research/data/.
