


Amid strong demand and tight supply, REALTORS® reported that properties that sold in January 2018 were typically on the market for 42 days, down from 50 days compared to the same month last year, according to the January 2018 REALTORS® Confidence Index Survey.[1] The median days on market have been broadly on a downtrend since 2011 when the properties typically were on the market for three months from May 2011, when this question was first asked in the RCI Survey, through March 2012.
During the November 2017–January 2018, properties typically sold within one month in Washington, California, Nevada, Utah, Colorado, Nebraska, Minnesota, Michigan, Kentucky, New Hampshire, Massachusetts, and the District of Columbia.

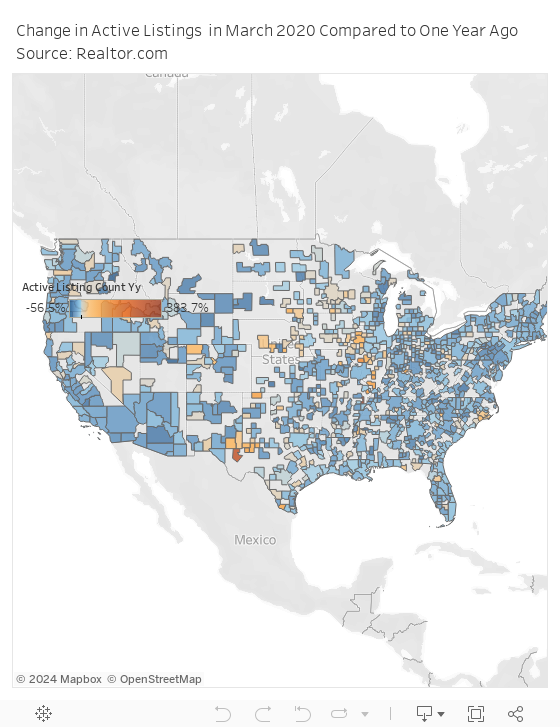
With fewer listings for sale in many areas, properties continued to sell at a faster pace in many metro areas. Of the 500 metro areas tracked by Realtor.com, active listings are lower compared to one year ago in 395 out of 500 metro/micro areas, 80 percent. With fewer listings, days on market have also dropped in 398 areas.
California, Washington, and Utah are home to the metro areas where properties are selling at the quickest time, based on how long they were listed on Realtor.com: San Jose-Sunnyvale-Sta. Clara, CA (27 days), San Francisco-Oakland-Hayward, CA (35 days), Vallejo-Fairfield, CA (44 days), San Diego-Carlsbad, CA (45 days), Seattle-Tacoma-Bellevue (48 days), Iowa City (48 days), Santa Rosa (49 days), Provo-Orem, UT (50 days), an Los Angeles, CA (50 days).
Use the data visualization below to check out the data across metro areas.
[1] In generating the median days on market at the state level, NAR uses data for the last three surveys to have close to 30 observations. Small states such as AK, ND, SD, MT, VT, WY, WV, DE, and D.C., may have fewer than 30 observations.
