


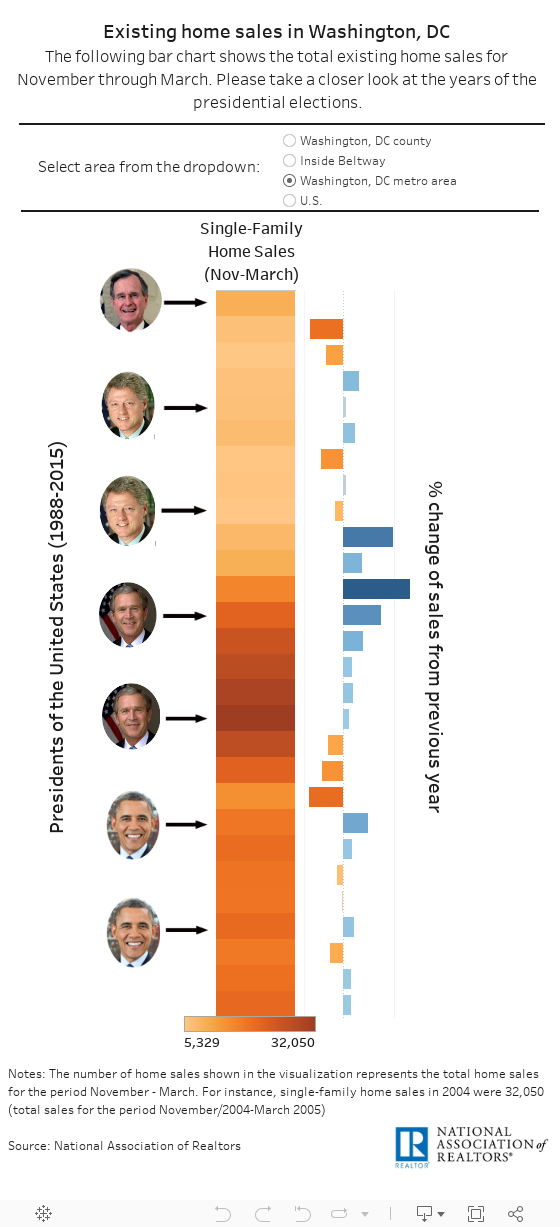
In view of the upcoming presidential elections, Washington, DC is getting ready to welcome the administration of the next president. But what does this mean for local housing market? Do elections affect housing market in the area? Let’s take a closer look at the single family existing home sales in the following areas in the past six presidential elections (1988-2015):
- Washington County, DC (which refers strictly to the District of Columbia alone),
- Counties inside the beltway (Montgomery County, Prince George’s county, Alexandria, Arlington County, Fairfax County, Falls Church), and
- Washington, DC metro area (as defined by the Office of Management and Budget).
The current study focuses on the total existing home sales between November and March, since activity for home sales is normally expected to be slower in these months than the other months of the year. For the three years surrounding the last six presidential elections (the year before, the election year, and the year after), here is the average home sales growth for each one of the areas[1]:
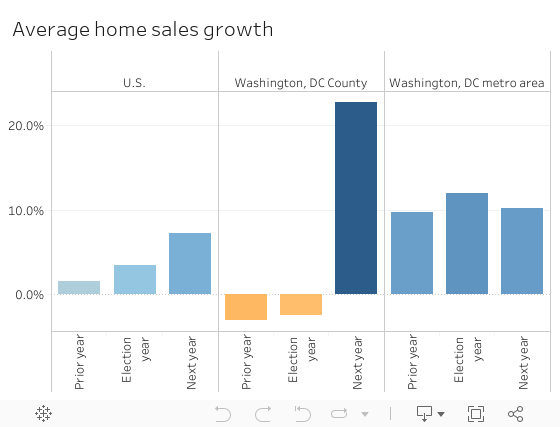
Based on the chart above, we notice that activity for home sales is busier in the election year and even better in the following year for Washington County, DC. In the Washington, DC metro area:
- The year before an election home sales rose by 10 percent on average.
- The year of the elections home sales rose by 12 percent on average.
- The year after the elections home sales rose by 10 percent on average.
We also notice that the metro area experiences higher growth in home sales than the county itself. This shows that people go beyond the District’s borders to buy single-family homes.
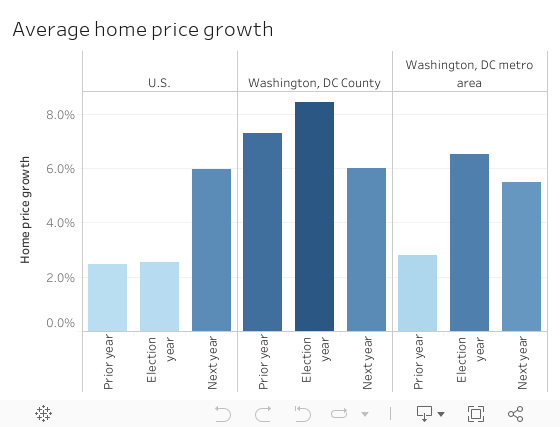
Likewise, median home prices had more gains in the election year than the previous and following year in both areas. According to the visualization below, in Washington, DC metro area, median home prices grew by 3 percent in the previous year of the elections, 7 percent in the election years and they went back to 5 percent growth one year after the elections. In a similar way, the District experienced 7 percent price growth in the previous year of the elections, 8 percent in the election years and 6 percent one year after the elections.
All in all, it seems that the following months will be very busy for Realtors in Washington, DC metro area. In buyer’s perspective, housing hunting process is expected to be more competitive while sellers can benefit from the anticipated busier activity.
Detailed analysis for each one of the election periods
Elections 1992: In the first year of Clinton’s presidency, home sales increased by 2 percent in Washington, DC metro area from the previous year. However, sales increased by 12 percent one year after the elections. Taking a closer look at the housing market in 1993, it seems that more factors boosted home sales that year. For instance, the Federal Housing Enterprises Financial Safety and Soundness Act of 1992 required Fannie Mae and Freddie Mac to devote a percentage of their lending to support affordable housing increasing their pooling.
Home prices grew less than the year before the elections. The median home price in 1992 was $141,424 in Washington, DC metro area while it was slightly higher at $148,819 in Washington County, DC for the period between November/1992 and March/1993.
Elections 1996: In the second term of Clinton’s presidency, home sales in Washington, DC metro area decreased by 8 percent compared to a year prior. In contrast, home sales increased by 48 percent in the year after the elections. In July 1997, the Taxpayer Relief Act changed the treatment of capital gains from residential real estate to exempt from taxation gains of up to $250,000 for singles and $500,000 for married couples.
With regards to home prices, the median home price in 1996 was $145,327 in the metro area while it was $138,720 at county level. Home prices increased in both areas in 1996 (3.4 percent price growth in metro area, and 6.1 percent price growth in the county).
Elections 2000: Under the first year of Bush’s presidency, home sales increased less than the year before the elections in Washington, DC metro area. In 1999, single-family home sales increased 65% while they rose 37% in 2000. Also, in the beginning of March 2000, the Dot-com bubble collapse began. This may be one of the reasons that home sales slowed down in 2000.
However, home prices increased in 2000. Median home price was $176,124 in the metro area while it was $166,136 in the county for the period between Nov/2000 and March/2001.
Elections 2004: In 2004, while the homeownership rate peaked with an all-time high at 69 percent, single-family home sales reached a peak in Washington, DC metro area (32,050 home sales in the period between November and March). As a result, median home price for the months November through March rose to $348,915 in 2004 from $272,314 a year earlier (28 percent increase).
Elections 2008: Nationwide, after the largest drop in home sales in 25 years, home sales continued to fall. However, in the Washington, DC metro area, single-family home sales started picking up in 2008. Home sales increased by 25 percent from a year earlier for the period November/2008- March/2009.
Nevertheless, home prices continued to fall in the metro area. Actually, median price dropped to 295,877 for the period Nov/2008-March/2009. That was a 21 percent decrease from a year earlier.
Elections 2012: During the second inauguration of Obama, home sales in the Washington, DC metro area rose by 11 percent from a year earlier. Home sales for the period Nov/2012 – March/2013 were almost 20,000 while the median home price increased to $320,468 (11 percent increase).
[1] Excluding the category of “Counties inside the beltway” because there are not available data for this area before 2004.
