


Building permits increased in most markets, but we see fewer permits and more expensive construction in high-priced markets.
In the era of limited housing inventory, adding new construction is one of the means to deal with housing affordability issues. At the local level, metropolitan areas are doing the most to address the housing shortage by building new housing. We looked at the volume of construction permits for single-family units in 382 metro areas[1] in 2016 and compared them to a year earlier.
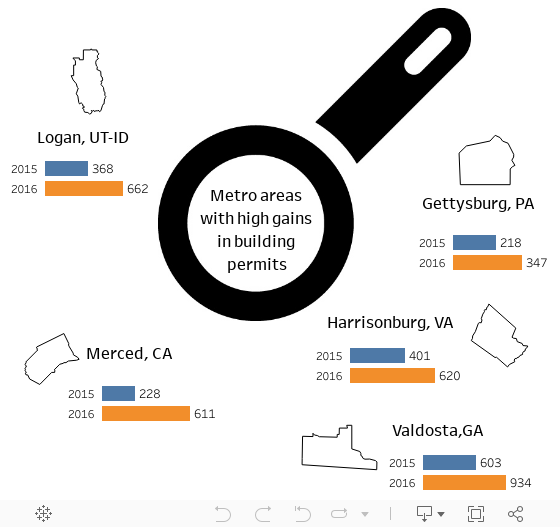
Indeed, 70 percent of metro areas issued more permits for single-family units in 2016 than in 2015. Meanwhile, 74 percent of those with an increase had a higher increase of permits than the national level (8 percent). Here are some of the metro areas, which had the highest gains in building permits for single-family units[2]:
Fewer permits and higher construction cost per unit for high-priced markets
However, that is not the case for many of the high-priced markets such as Miami, New York, San Diego and Honolulu. Actually, the number of permits issued for single-family units dropped in these areas in 2016. For instance in the New York metro area, building permits for single-family units decreased 7 percent from a year earlier while single-family construction decreased 14 percent in the Honolulu metro area.
In the meantime, the construction cost per unit[3] increased in these areas. Although construction cost per unit is already high, it increased even further in 2016. In New York metro area construction cost per unit rose 5 percent from $289,250 to $302,700 while it increased 4 percent in Honolulu from $390,220 to $405,350.
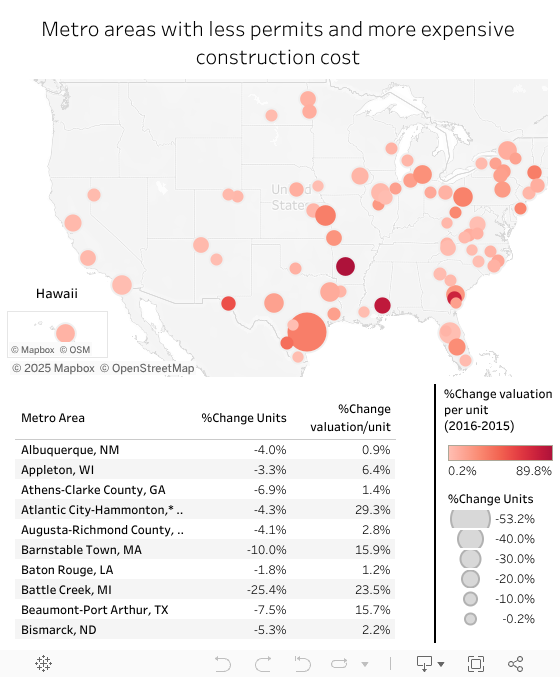
Here are the metro areas, which had fewer building permits for single-family units while construction cost per unit increased:
It seems that there are two ways to interpret this oxymoron:
1. High construction cost pushed down the construction activity for single-family units in these areas.
Fewer single-family units are built because construction cost is more expensive. One of the most important elements of construction cost is labor cost. Based on Occupational Employment Statistics[4], we see that the annual wage per employee increased between 2014 and 2015. While labor is already expensive in these areas, the increase in wages makes housing construction more expensive. For example, Honolulu is included in the list of the top paying metro areas for this occupation. The annual wage per employee rose from $64,800 in 2014 to $66,859 in 2015 (3.2 percent increase).
In addition, a survey of single-family builders conducted by NAHB in June 2016[5] shows that shortages of labor and subcontractors have become more widespread than they were a year ago. According to the survey, the share of builders reporting either some or a serious shortage has skyrocketed from a low of 21 percent in 2012, to 46 percent in 2014, 52 percent in 2015, and now 56 percent in 2016. The net result of the labor shortage, based on the survey, is that 75% of builders say they have had to pay higher wages and bids, 64% have delayed projects, and 68% have raised home prices.
2. Construction of high-end units pushed up construction cost per unit although there are fewer permits.
It is unfortunate that the Building Permits Survey does not collect any information about the square footage of the new units permitted. However, we know that construction cost is affected by the size of the single-family unit and the construction materials. The fact that construction cost increased in high-priced areas while there were fewer permits in 2016 could mean that more high-end units tended to be built in these areas.
Nevertheless, according to first quarter 2017 data from the Census Quarterly Starts and Completions by Purpose and Design[6], median single-family square floor area decreased to 2,423 in 2016 from 2,466 in 2015 for started units. Similarly, for completed units, median single-family square feet floor area also decreased to 2,422 in 2016 from 2,467 in 2015. This recent small decline in size indicates that builders may be adding more entry-level homes in the inventory.
This is good news for first-time homebuyers and, therefore, the homeownership rate. By increasing construction labor, even more entry-level homes are expected to enter the market. With more entry-level homes and less expensive labor cost, more potential homebuyers will be able to afford a home purchase and, thus, the homeownership rate might go back to norm.
[1] U.S. Census Bureau, Building Permits Survey.
[2]The selected metro areas had more than 200 building permits issued in 2015.
[3] Construction cost per unit (for single-family units) = valuation for single-family units/permits for single-family units; add brief description of what is included vs. not included in total valuation like we discussed before (i.e. land, materials, labor, etc) and a link to any documentation from the US Census if it is available
[4] The Occupational Employment Statistics (OES) program produces employment and wage estimates annually for over 800 occupations. https://www.bls.gov/oes/
