Within the wider context of regional economics, geographic mobility allows households to move from one area of the country to another for such things as more attractive job opportunities or better housing options. Over a period of time, movement of households limits the regional disparities of income and unemployment that would occur if moving was less frequent.
The following interactive dashboard lets you visualize Migration and Geographic Mobility data at the national and regional level collected from 2006 through 2013 as part of the Current Population Survey (CPS). Specifically, the visualization compares the percentage of Movers and Non-Movers by year, region and income distribution. The visualization reveals that:
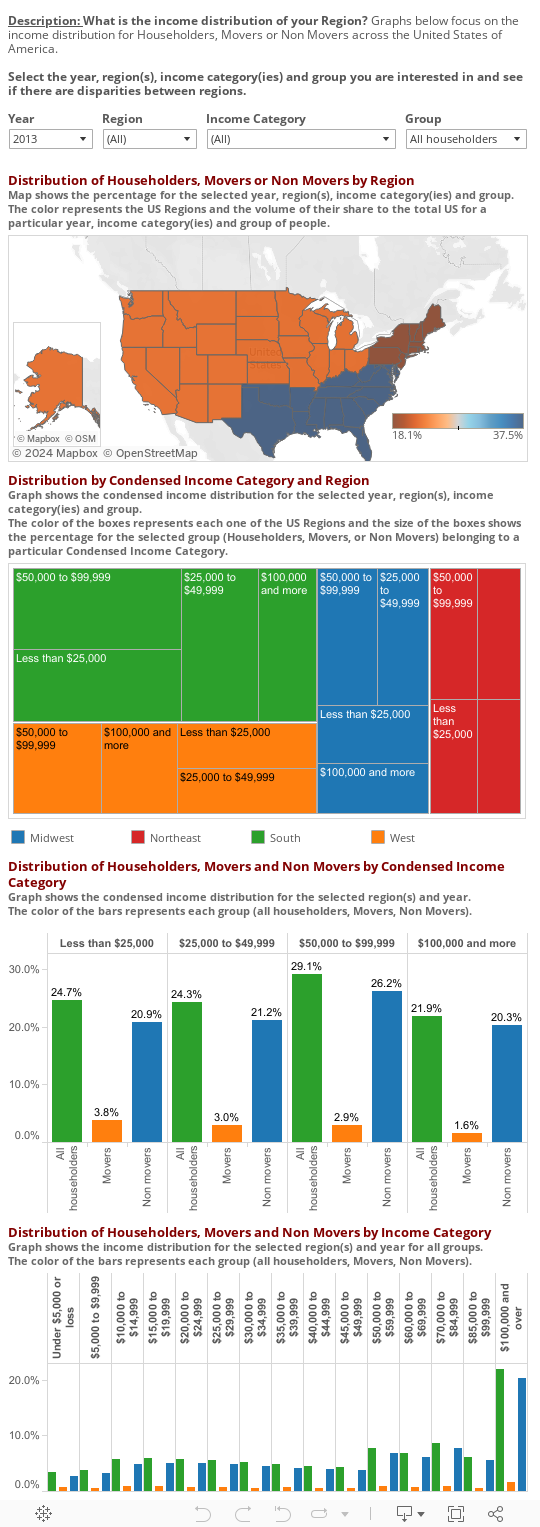
At the National level:
- Since 2006, the number of U.S. Households increased by 7.08% (from 114.4 to 122.5 million) while the number of Movers decreased by 7.58% (from about 15.0 to 13.9 million).
- In 2013 the dominant household income was between $50,000 and $99,000 (29.1%). However, those with income less than $25,000 were more likely to move than those with higher income. This fact may be explained by the differences in homeownership patterns, particularly the higher proportion of renters among households with low incomes.
- Since 2006 there has been a steady increase of households with income of $100,000 or more (Movers and Non Movers). Nevertheless, the range “$100,000 or more” still includes the fewest households of any income categories.
At the Regional level:
- The South has the largest number of Householders and Movers. Eight out of 22 Householders (37.5%) and one out of 22 Movers (4.6%) are located in the South.
- Although the Midwest and the West have the same percentage of Householders (22%), the West experienced a higher level of mobility than the Midwest (3.0% versus 2.3%).
- The Midwest shows the highest percentage of Movers with income “less than $25,000” (37.31% of its Movers) while the West has the highest percentage of Movers with income “$100,000 or more” (17.11% of its Movers).