


While total housing inventory continues to fall year-over-year for the last 21 months, more markets are turning into a sellers’ market. Under limited inventory conditions, sellers get more confident. The increased demand exceeds the existing supply, which means that more buyers are seeking to purchase properties than there are available homes on the market. As a result of the bidding wars, sellers are able to secure a sale price that is higher or similar to the listing price. These kind of conditions are typically called a “sellers’ market.”
We calculated the ratio[1] of sale to the first original asking price for 262 counties in the United States. The study provides statistics only for the counties that we receive data with good coverage. In simple words, the ratio shows us what percentage of the first original asking price sellers were able to get. For instance, the ratio for the United States is 95%, which means that homeowners sold their house for $228,400[2] while the asking price was $240,400. Alternatively, we could say that nationwide, sellers sold their house for 5% less than their asking price.
At local level, it is very interesting to see how the ratio of sale to ask price differs from county to county. The ratio varies between 80% and 99%. The higher the ratio, the higher the percentage of sale to asking price which suggests a stronger market for sellers. Adams, CO was the county with the highest ratio (99.3%) while Rabun, GA had the lowest ratio (80.3%).
Visualization
Looking at the visualization above, we make the following observations:
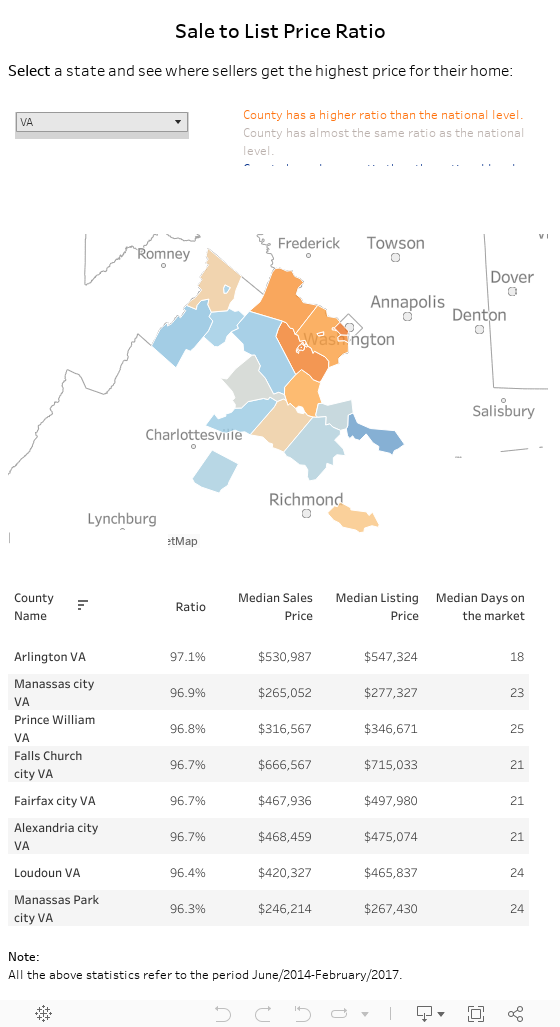
1. Ratio is higher in counties that are close to a city.
The combination of the limited inventory and increased demand is the reason that sellers get a higher percentage of their asking price in these counties.
Example:
In Minnesota, Virginia and Maryland, counties close to the cities[3] had a higher ratio than other counties in the area. Anoka County, MN, Arlington County, VA and Prince George County, MD had the highest ratios across these areas.
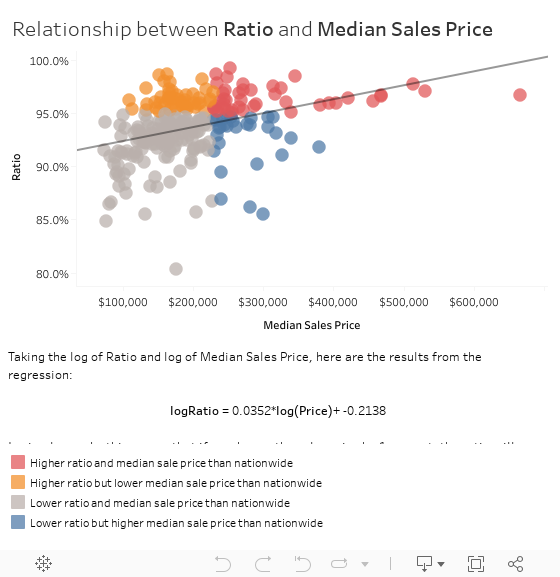
2. Ratio is higher in areas where homes are expensive.
It tends that inventory is more limited in the areas where home prices are higher as it is one of the main reasons that home prices are increasing. Although homes are already expensive, potential buyers are willing to make an offer closer to the asking price in order to win the bidding war.
After regressing Ratio to Median Sale Price, we get that if we change median sales price by 1 percent the ratio will increase by 0.4 percent[4].
Example:
In Washington DC metro area, the District had the highest ratio (Ratio= 97.8%, median sales price $513,000 followed by Arlington, VA (Ratio=97.1%, median sale price=$547,324). In contrast, Frederick, VA had the lowest ratio (95.2%) in the area while median sale price was $217,500.
Visualization
3. Ratio is higher in fast market areas
As a result of the increased demand and high competition among potential buyers for the limited number of homes for sale, homes stay on the market for a short period. Typically, homes stay on the market for 35 days in the counties where the ratio is higher than 96%. In contrast, the median days on the market for counties with a ratio lower than 96% is 62 days.
The fact the low days on market are associated with lower price discounts implies the county level differences do broadly reflect the tightness of the local market.
Whether you are a seller or a buyer, a local real estate agent will be the most appropriate source to trust for a strategy of how to deal with conditions in your market. If you are a seller, your agent can tell you how high of a price to ask for, and if you are a buyer, what you need to offer in order to compete with other potential homebuyers.
[1] Ratio is calculated based on the first original asking price.
[2] Median sale price for the U.S. in February 2017.
[3] In a radius of 1.5 hour driving distance
[4] It is true that our observations are limited to draw conclusions for the relationship between Ratio and Median Sale Price. However, we thought that it is interesting to show the results that we get for this limited sample:
LogRatio = 0.0352025*log(Price)+-0.213799, R-squared = 0.192
