


There is a wealth of publicly available information about renters, but there is relatively little data known about landlords who perform the important role of providing housing to the nation’s 48 million renter households. Understanding the profile of landlords is important because any policy pertaining to renters also impacts landlords and their ability to provide rental housing supply. Currently, there is a moratorium on evictions to assist tenants, but this moratorium also impacts the ability of a landlord to meet their own financial obligations and to continue operating viably.
One important source of information pertaining to landlords is the Rental Housing Finance Survey (RHFS) which is collected by the Department of Housing and Urban Development (HUD). This survey collects data on rental loan origination volumes, property characteristics associated with these originations, and operating cost and revenue characteristics for the rental housing stock in the United States. The Rental Housing Finance Survey (RHFS) was first conducted in 2012 (included only multifamily rental properties), then again in 2015 (included single-family and multifamily rental properties), and in 2018 (included single-family residential and multifamily residential properties with at least one housing unit intended for rent). In the 2018 survey, the reference period of the survey was all 12 months of 2017.
Here are some landlord statistics from the 2018 Rental Housing Finance Survey.
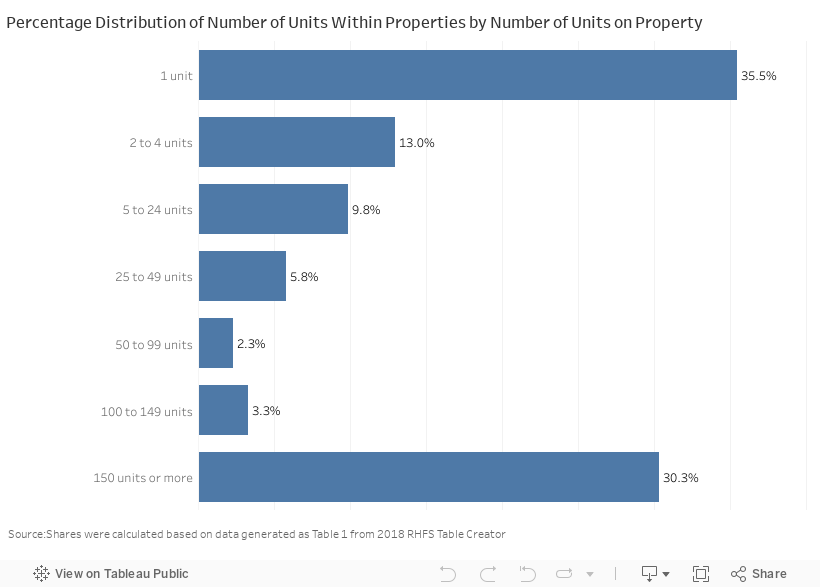
48% of rental units are in properties with 1- to 4-units
Of the 48.3 million rental units in 2017, 48% of the units were in properties1 with 1-to 4-units, most of which are owned by individuals and run by the owners.
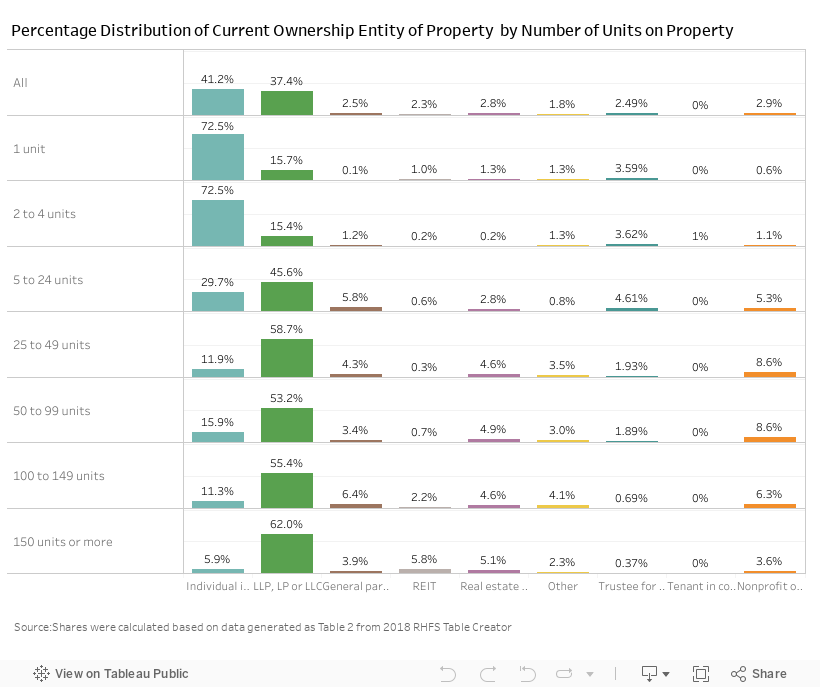
41% of rental properties are owned by individuals
Individuals are the main types of owners of rental housing, accounting for 41% of the owners of all rental units. However, in properties with 1-unit and 2-to-4- units, individual owners accounted for 72.5% of all owners.
Limited liability corporations, limited partnerships, and limited liability corporations account for more than half of owners in the properties where there are 25 units or more in a property.
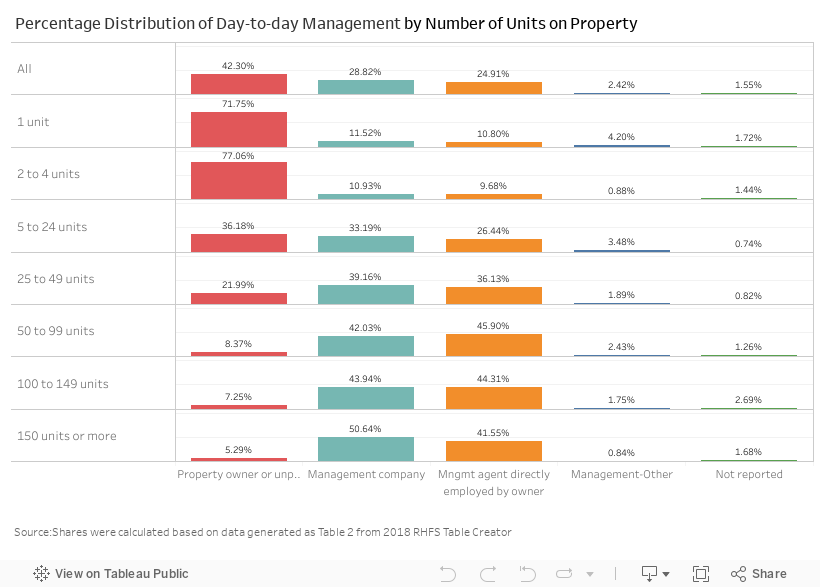
42% of rental properties are run day-to-day by the owners
In 42.3% of all rental properties, the day-to-day managers are the owners. This is then an estimate of the share of housing units run by ‘mom and pop’ landlords, which is generally understood as an owner who mainly does the day-to-day management of the business.
Mom and pop landlords are more prevalent in properties with 1-to 4-units. In properties with 1-unit, 71% of those doing the day-to-day management were the owners. In properties with 2- to 4-units, 77% of the those doing the day-to-day management were owners. Nearly half (48%) of rental housing units are in properties that have 1-to-4 units.
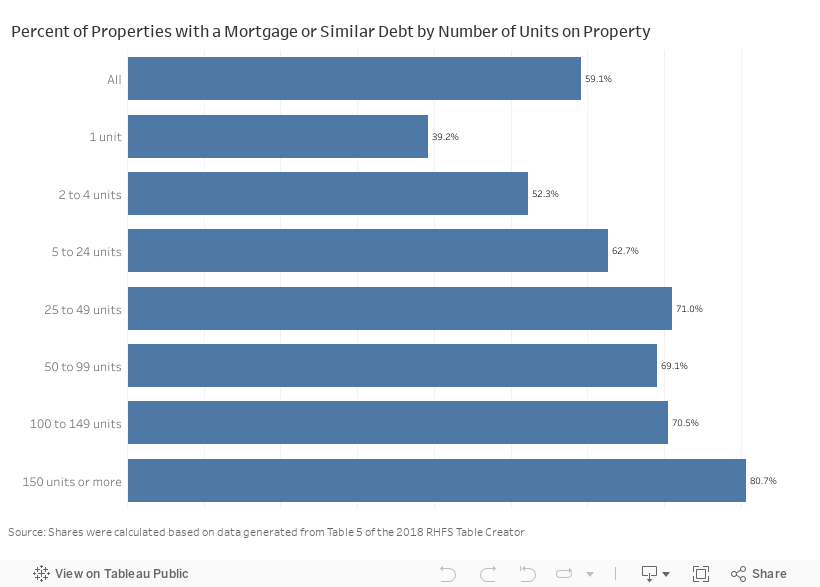
59% of properties have a mortgage or similar debt
More than half of properties have a mortgage or similar debt on them. The share of 1-unit properties with debt is lower, at 39.2%. The more units in a property, the higher is the fraction with a mortgage on them. Of properties with 150 or more units, 80.7% of the units have a mortgage.
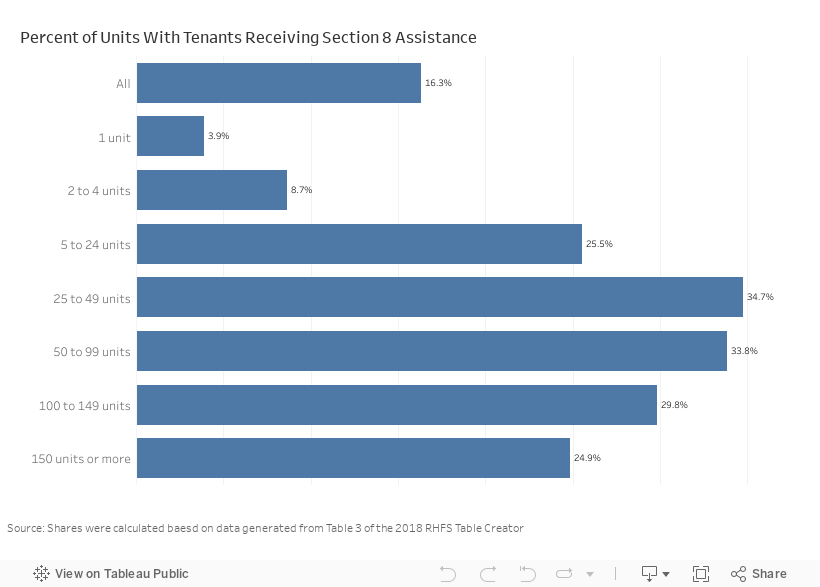
16.3% of tenants received Section 8 assistance in 2017
Landlords help provide affordable rental housing. Of all rental units, 16.3% had tenants that received rental assistance in 2017. In properties with at least 5 units, more than 25% of tenants receive Section 8 rental assistance.
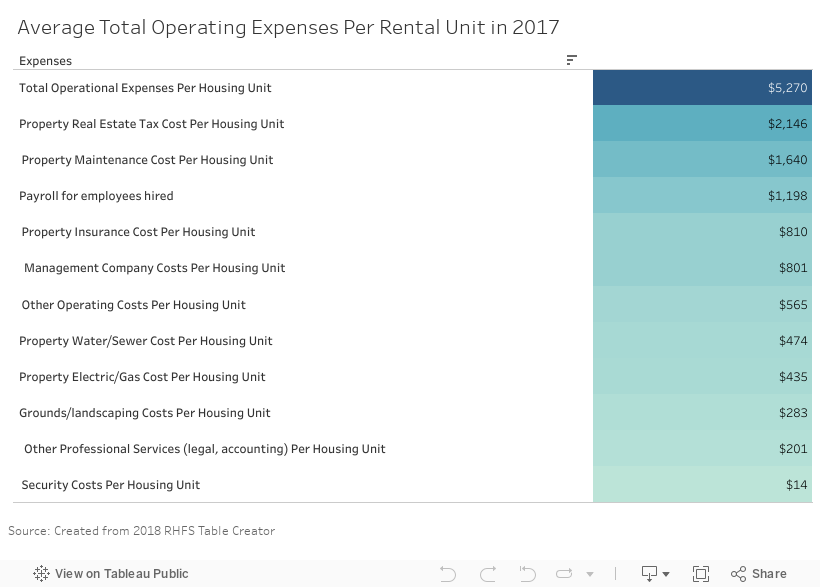
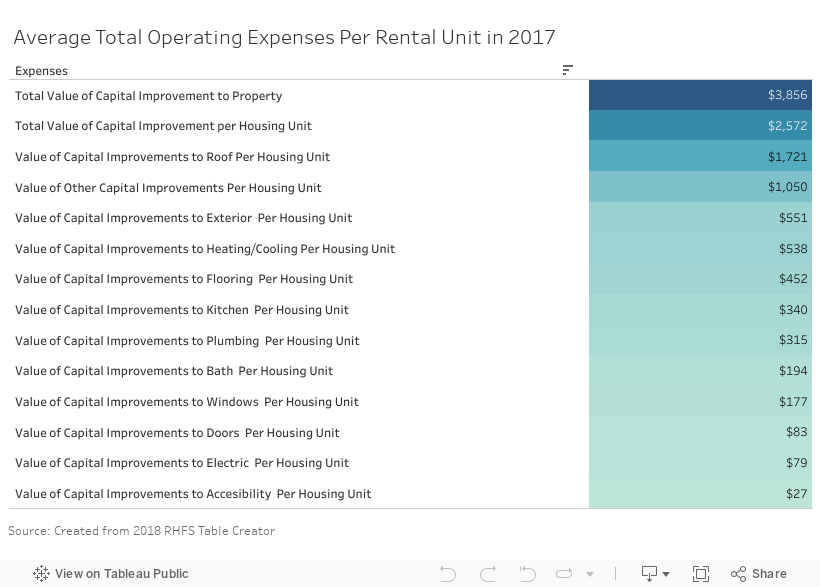
Average Annual Operating and Capital Expenses Per Unit: $830 in 2020 dollars
Landlords have operating and capital expenditure costs needed to maintain their buildings to keep them safe and decently livable for their tenants. These costs are passed on to tenants, but when tenants are not able to pay rent, the landlords have to spend for these costs, creating a cash flow problem. In 2017, the average annual operating expenses per unit was $ 5,270. The average annual capital expenditure was $3,856, or a total of $9,126 per unit per year, or $760/month. If that is inflation to 3% inflation cost per year, that is equivalent to $830 in 2020 dollars.
1 For the purposes of the RHFS, a property includes all housing units and structures commonly financed. A property may consist of one building at one address, or a property may consist of more than one building or more than one street address, if these structures are commonly owned and financed, geographically proximate, and considered part of the same property. (Properties without basic street addresses are not sampled in RHFS, which may add to sampling error.)
