


Summary:
- Despite strong gains in 2015, sluggish construction persists
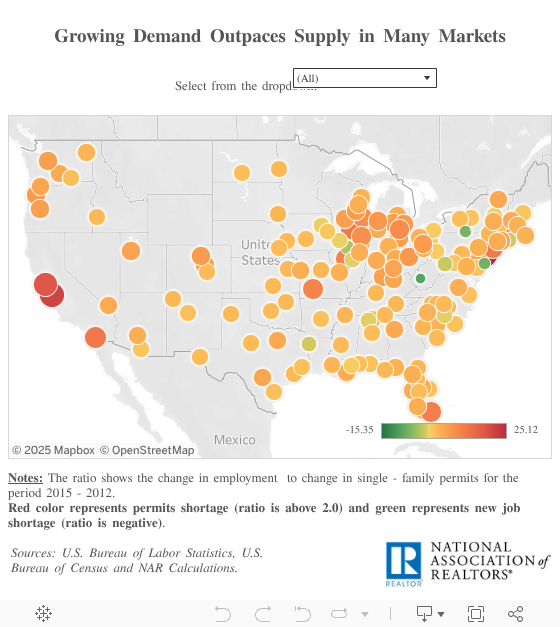
- Supply constraints are wide spread
- Prices are likely to continue to rise in markets with inadequate supply in relation to job creation
While the homeownership rate tumbled in the wake of the great recession and millions of owners shifted to rentership, the total population and number of families continued to expand along with the need to house them. Construction has been limited and focused on the upper-end of the market. Without an expansion of the total stock of homes, prices and rents will continue to rise at the expense of affordability.
In normal times the supply of homes for sale is driven by two sources: new construction and existing homes brought to the market for sale. In the aftermath of the great recession foreclosures and short sales emerged as an important channel for inventory but have receded. Negative equity and student debt now keep some owners from bringing existing stock to the market, but limited inventory also acts as a disincentive for some would-be sellers. As the market normalizes, the emphasis on traditional channels of inventory, new construction in particular, has grown.
The relationship between employment and construction can provide insights to the extent of the shortage. Historically, there is a strong relationship between new construction and the number of newly employed workers. From 1990 to 2002 the US averaged 1.2 for total permits (single family and multi-family), or 1 permit for every 1.2 new workers. For single family permits this employment-to-permits (EP) ratio was 1.6. Both of these ratios have been above their historic averages since 2012 and peaked in 2014.[1] The total EP ratio fell from a high of 2.3 in 2014 to 2.0 in 2015 as strong single family permits growth outpaced steady improvements in new employment. The single-family EP ratio improved as well, from 3.7 to 3.4, but remains further from its long-term average.

This imbalance was widespread with 81.3 percent of the 171 metro areas tracked having a single family EP ratio greater than 1.6. Furthermore, 36.3 percent of the markets had a ratio of 4.0 or higher. When multi-family construction was included in the total, the distribution was not as extreme, but 52.9 percent had an EP ratio of 2.0 or higher and 29.1 percent were bunched between a ratio of 2.0 and 3.0 indicating an imbalance.

Based on the EP ratio, the gap between the current level of permits and one that would achieve the historic EP ratio or strike a balance between employment and permits can be calculated.[2] Markets with the biggest absolute shortage of permits tend to be large markets with strong employment and price growth. New York led the list followed by Dallas and San Francisco. California dominated the top 10 list with three markets including San Jose and San Diego.

The list was also ranked by the 3-year employment to permits ratio (not pictured here). Trenton (NJ) topped that list with a ratio of 25.1, up from 22.3 in 2014, which resulted from strong employment gains and minimal single family permitting. Three California markets follow Trenton, but other smaller markets made the list including Springfield (MA) and two Michigan markets in Ann Arbor and Grand Rapids. Roughly a dozen markets were in balance with ratios near 1.6 including Pensacola, Huntsville, and Columbia (MO).
Supply shortages and price growth have continued through 2016. Reports of bidding wars are common while stories of frustrated would-be home buyers abound. Construction analysts forecast continued improvement and media reports point to gains in the much needed entry-level portion of the market, but builders face headwinds from financing issues, high labor costs, regulations, and limited buildable land. A decline in negative equity that unlocks existing inventory will help, but the only way to house an expanding workforce and population is through construction.
<a href='#'><img alt='Dashboard 1 ' src='https://public.tableau.com/static/images/Ra/Ratio-Employment-Permits/Das...' style='border: none' /></a>
//
For the full list of Single Family ranking by 3-year employment-to-permits ratio please click here >
---------------------------------------------------------------------------------------------
[1] To remove annual volatility, a 3-year moving average was calculated.
[2] R = historical average of permits/employment ratio
Inventory balance (excess/shortage) = actual employment / R – actual permits