


As of the second quarter of 2021, the largest metro areas (with populations of at least 2 million) are experiencing tougher commercial market conditions compared to smaller markets. The office market continues to see rising vacancy rates, while vacancy rates are trending below pre-pandemic levels in the multifamily, industrial, and retail markets, according to NAR's analysis of 390 markets.
Office Vacancy Rate Continues to Climb While Multifamily, Industrial, and Retail Vacancy Rates Fall Below Pre-Pandemic Levels
Of the core property markets (multifamily, office, industrial, and retail), only the office property market is still suffering from negative net absorption and higher vacancy rates, according to NAR's analysis of CoStar® data on 390 metro or micro areas.
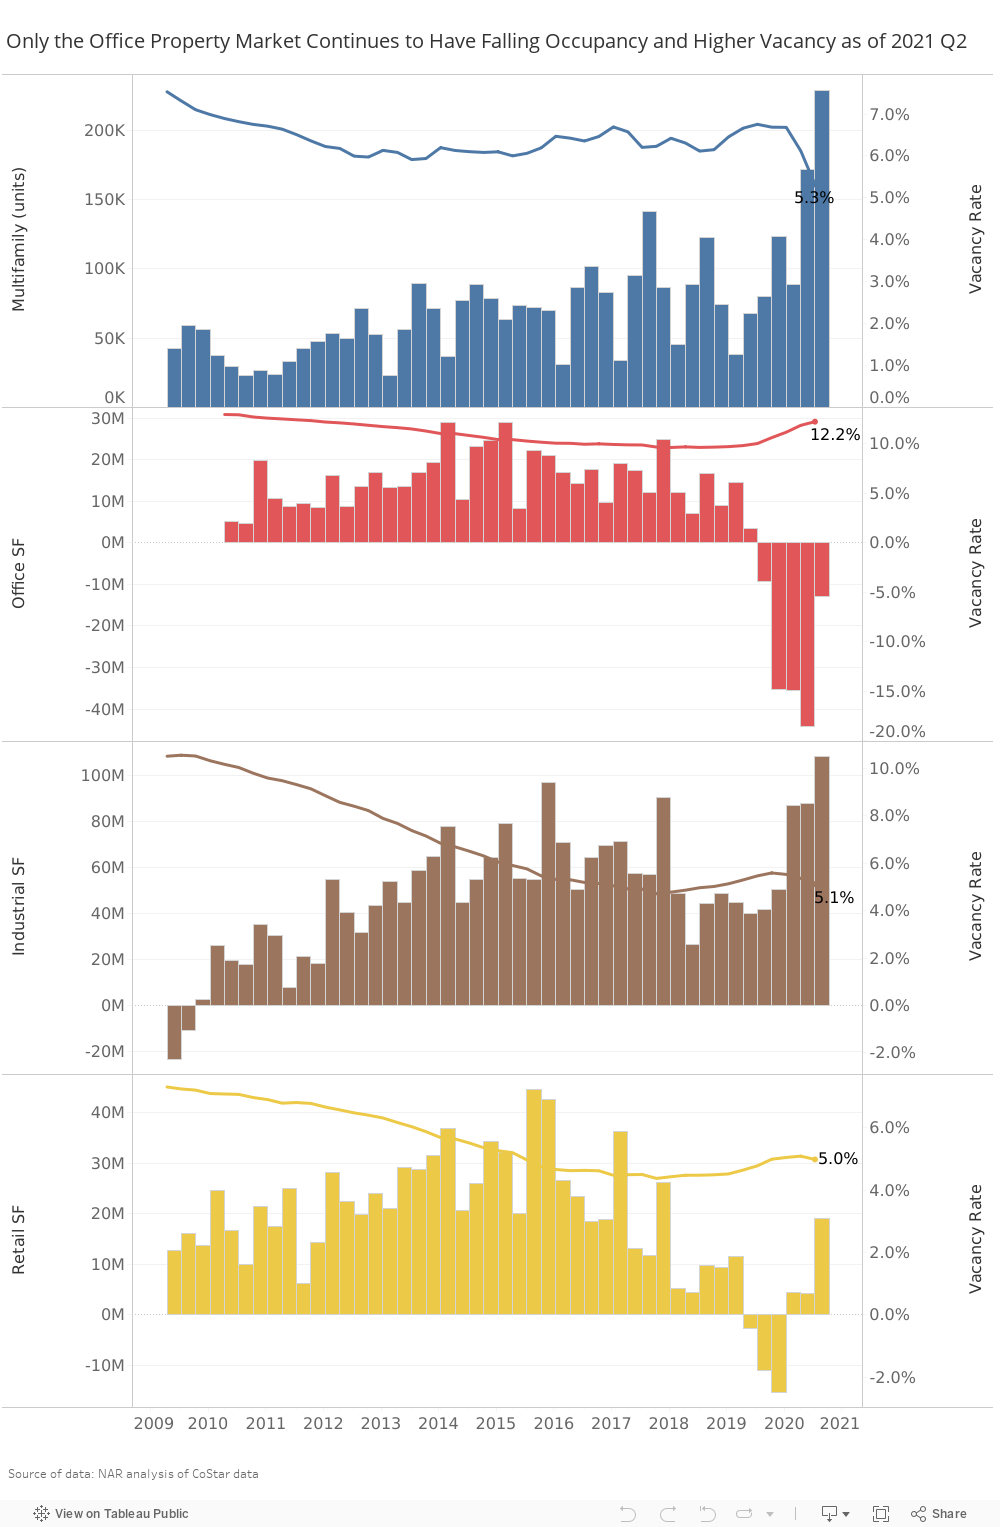
On a national level, the office market continued to see a decline in occupancy and a higher vacancy rate in the second quarter. The office property market continues to get hit with declining occupancies as a quarterly negative net absorption of 12.8 million square feet brings the total loss in occupancy to 114.6 million square feet since the second quarter of 2020. With declining occupancy, the office vacancy rate rose to 12.2%, up from 9.8%in 2020 Q1 prior to the pandemic.
Meanwhile, the multifamily property market is soaring and experienced the highest net absorption since 2000. In 2021 Q2, there was a net increase in occupancy of 228,973 compared to the prior quarter. With soaring demand, the vacancy rate has fallen from 6.7% in 2020 Q1 to 5.3% as of 2021 Q2. (Read more about multifamily market trends here).
Like the apartment market, the industrial property market has seen rising occupancy due to the demand for warehousing and distribution space given the surge of e-commerce sales. Since 2020 Q2, 375.6 million square feet of industrial office space has been absorbed. Worth noting is that the absorption of industrial space more than offsets the negative net absorption of office space use. The industrial vacancy rate is also now at 5.1%, which is slightly lower than the 5.3% vacancy rate in 2020 Q1.
The demand for retail space also decreased in the wake of the pandemic, but the retail property market made a turnaround in 2020 Q4, with total positive net absorption of nearly 28 million square feet through 2021 Q2. Nationally, the vacancy rate stood at 5%, just slightly higher than 4.6% in 2021 Q1 prior to the pandemic.
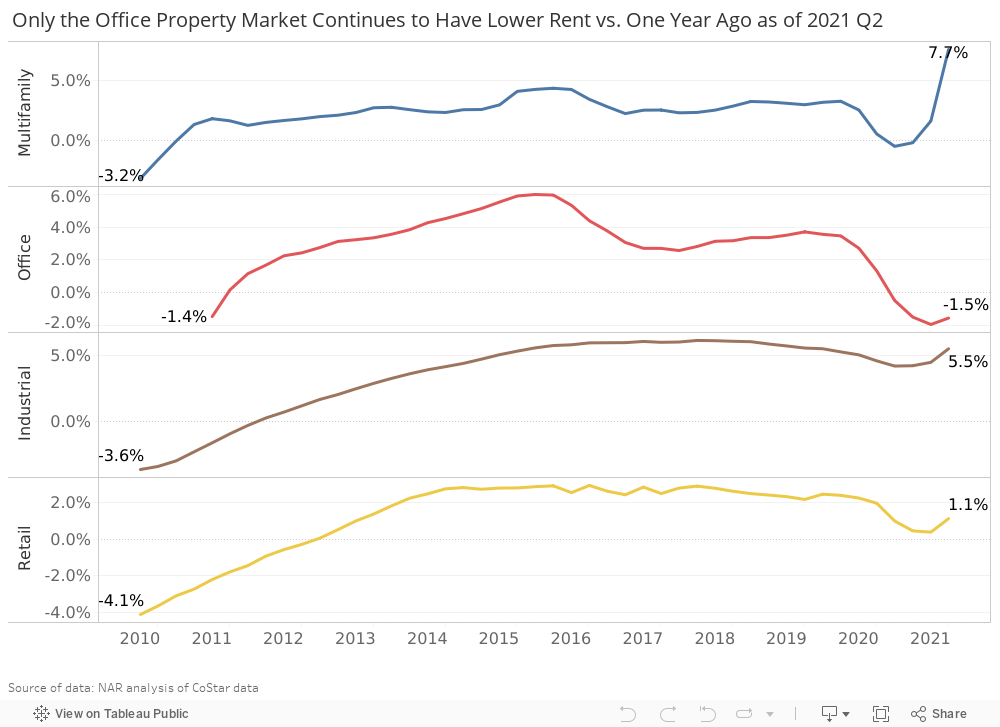
With weak demand, only the office sector also continues to see lower rent growth nationally from one year ago, with asking rents down 1.5% year-over-year (2.7% in 2020 Q1). Meanwhile, multifamily rents have soared by 7% year-over-year (2.5% pre-pandemic), industrial rents were up 5.5% year-over-year (5% 2020 Q1), and retail properties’ rent rose 1.5% (2.2% in 2020 Q1).
Stronger Demand for Residential and Commercial Real Estate in Mid-size Metros vs Large Metros
One outcome of the pandemic is the migration of people and businesses from large cities as the pandemic led to an increase in workers, especially tech and computer workers, working from home. Are the cities going to "hollow out" as people move to less dense areas even after the pandemic winds down?
One indicator of demand is vacancy rates. To assess the demand for commercial real estate, I calculated the average vacancy rate by population sizes of 390 markets, using the following population sizes: 0 to 100,000 (29 markets), 100,000+ to 250,000 (164 markets), 250,000+ to 500,000 (82 markets), 500,000+ to 1 million (54 markets), 1 million+ to 2 million (23 markets), and 2 million+ (38 markets).

Across property markets, there is a clear trend that vacancy rates are highest in the markets with a population of over 2 million. The wide gap across markets is stark in the office market where the average vacancy rate was 11.4% in the markets with a population of over 2 million, which is more than twice the vacancy rate of around 5% in smaller markets with population of up to 250,000 people.
While the gap in vacancy rates in the multifamily market is not as stark, there is still a noticeable gap between the vacancy rate in the metro areas with a population of over 2 million, at 5.4%, compared to the vacancy rate in the metro areas with a smaller population size of 100,000 to 250,000 people, at 4.2%. The smallest metro areas (with populations of less than 100,000) also have high vacancy rates.
Focusing in on the office market, the maps below show that vacancy rates of over 10% (blue areas) are mostly found in metro areas with at least a population of 1 million. The metro areas with the highest office vacancy rates as of 2021 Q2 are Houston, Texas (18.9%), San Rafael, California (18.7%), Dallas-Fort Worth (17.9%), Texas, Warner Robins, Georgia (16%), Kankakee, Illinois (15.7%), and Washington, DC (15%).

Office Occupancy and Rents Still Down in Many Large Markets
Office occupancy is starting to recover in San Francisco, with 746,000 square feet of positive net absorption of office space. However, this is still a small portion of the 6.8 million square feet of occupancy the office sector lost since the pandemic. A major market that saw an increase in positive net absorption was Boston, with an increase in occupancy of 233,239, although this is also a small fraction of the nearly 6 million square feet of commercial office space that became unoccupied in the past 12 months. However, most of the major cities continue to post negative year-over-year growth: New York metro area (-5.1 million square feet), Chicago (-3 million square feet), Washington DC (-2 million square feet), Los Angeles (-1.1 million square feet).
Office rents are still below year-ago levels in the major commercial markets of San Francisco (-8.2%), New York (-4%), Orange County, California (-3.3%), Los Angeles (-1.8%), Washington, DC (-1.2%), as well as in the tech-driven markets of Seattle (-1.7%), San Jose (-1.7%), and Austin (-0.8%).
However, office rents are up in mid-size markets. Several are in the South region states of Florida (Fort Myers, Naples, Sarasota, Port St. Lucie, Miami, Homosassa Springs), North Carolina (Burlington, New Bern, Goldsboro, Asheville), South Carolina (Sumter), Georgia (Warner Robins, Valdosta), Kentucky (Owensboro), and Alabama (Gadsden). Others are in the Western states of Arizona (Tucson), Nevada (Las Vegas), and California (Fresno).In the Northeast, it’s the states of Rhode Island (Providence) and Connecticut (Stamford) with metro areas showing rising rents.


Office Outlook: Expect Elevated Vacancy Rates and Low Rents Through the Next 3 Years at Least
During the Great Recession, it took 10 years for the vacancy rates to return to their pre-Great Recession level. Data from Cushman and Wakefield shows that the office vacancy rate rose from 12.7% in 2007 to a peak of 17.2% in 2010 and was restored to 12.7% only in 2019.
In the large states (with a population of over 1 million) that have suffered huge losses in occupancy, additional ongoing construction will add to the inventory of available space. For example, in the New York metro area, there is currently ongoing construction equivalent to 22.5 million square feet, or 2.4% of the current inventory. In Boston, 14 million square feet is also underway, equivalent to 4% of the current inventory. In Seattle, San Jose, and Austin, the ongoing construction amounts to more than 5% of the current inventory.
With the continued evolution of the pandemic and the uncertain impact on the economy, businesses, and work policies, businesses are not likely to lock in leases for as much space at longer durations. Currently, about half of computer and tech workers still work from home, and the resurgence of Delta variant cases will cause a drag on the return of the workforce to the office. So, expect elevated vacancy rates through at least 2025 judging from the experience during the Great Recession.

